v0.9.0 Figures and a provable record: figures drawn from the project, the methods written, and certificates that make a result again

Spatial transcriptomics you can check

SituCraft opens the output of a 10x Genomics Xenium run, checks it, and shows the tissue, its transcripts and its cells at any zoom. It makes and compares cell segmentations, types and reviews the cells, brings in the H&E, asks how the tissue is organized, compares groups of subjects, and writes figures, methods and certificates that anyone can check by making the results again, keeping every decision on record, and an AI agent or a script can drive it in a window you watch. It runs on your own computer as one self-contained program, installed with a single command: no account, Python or R, and your data never leave your machine.

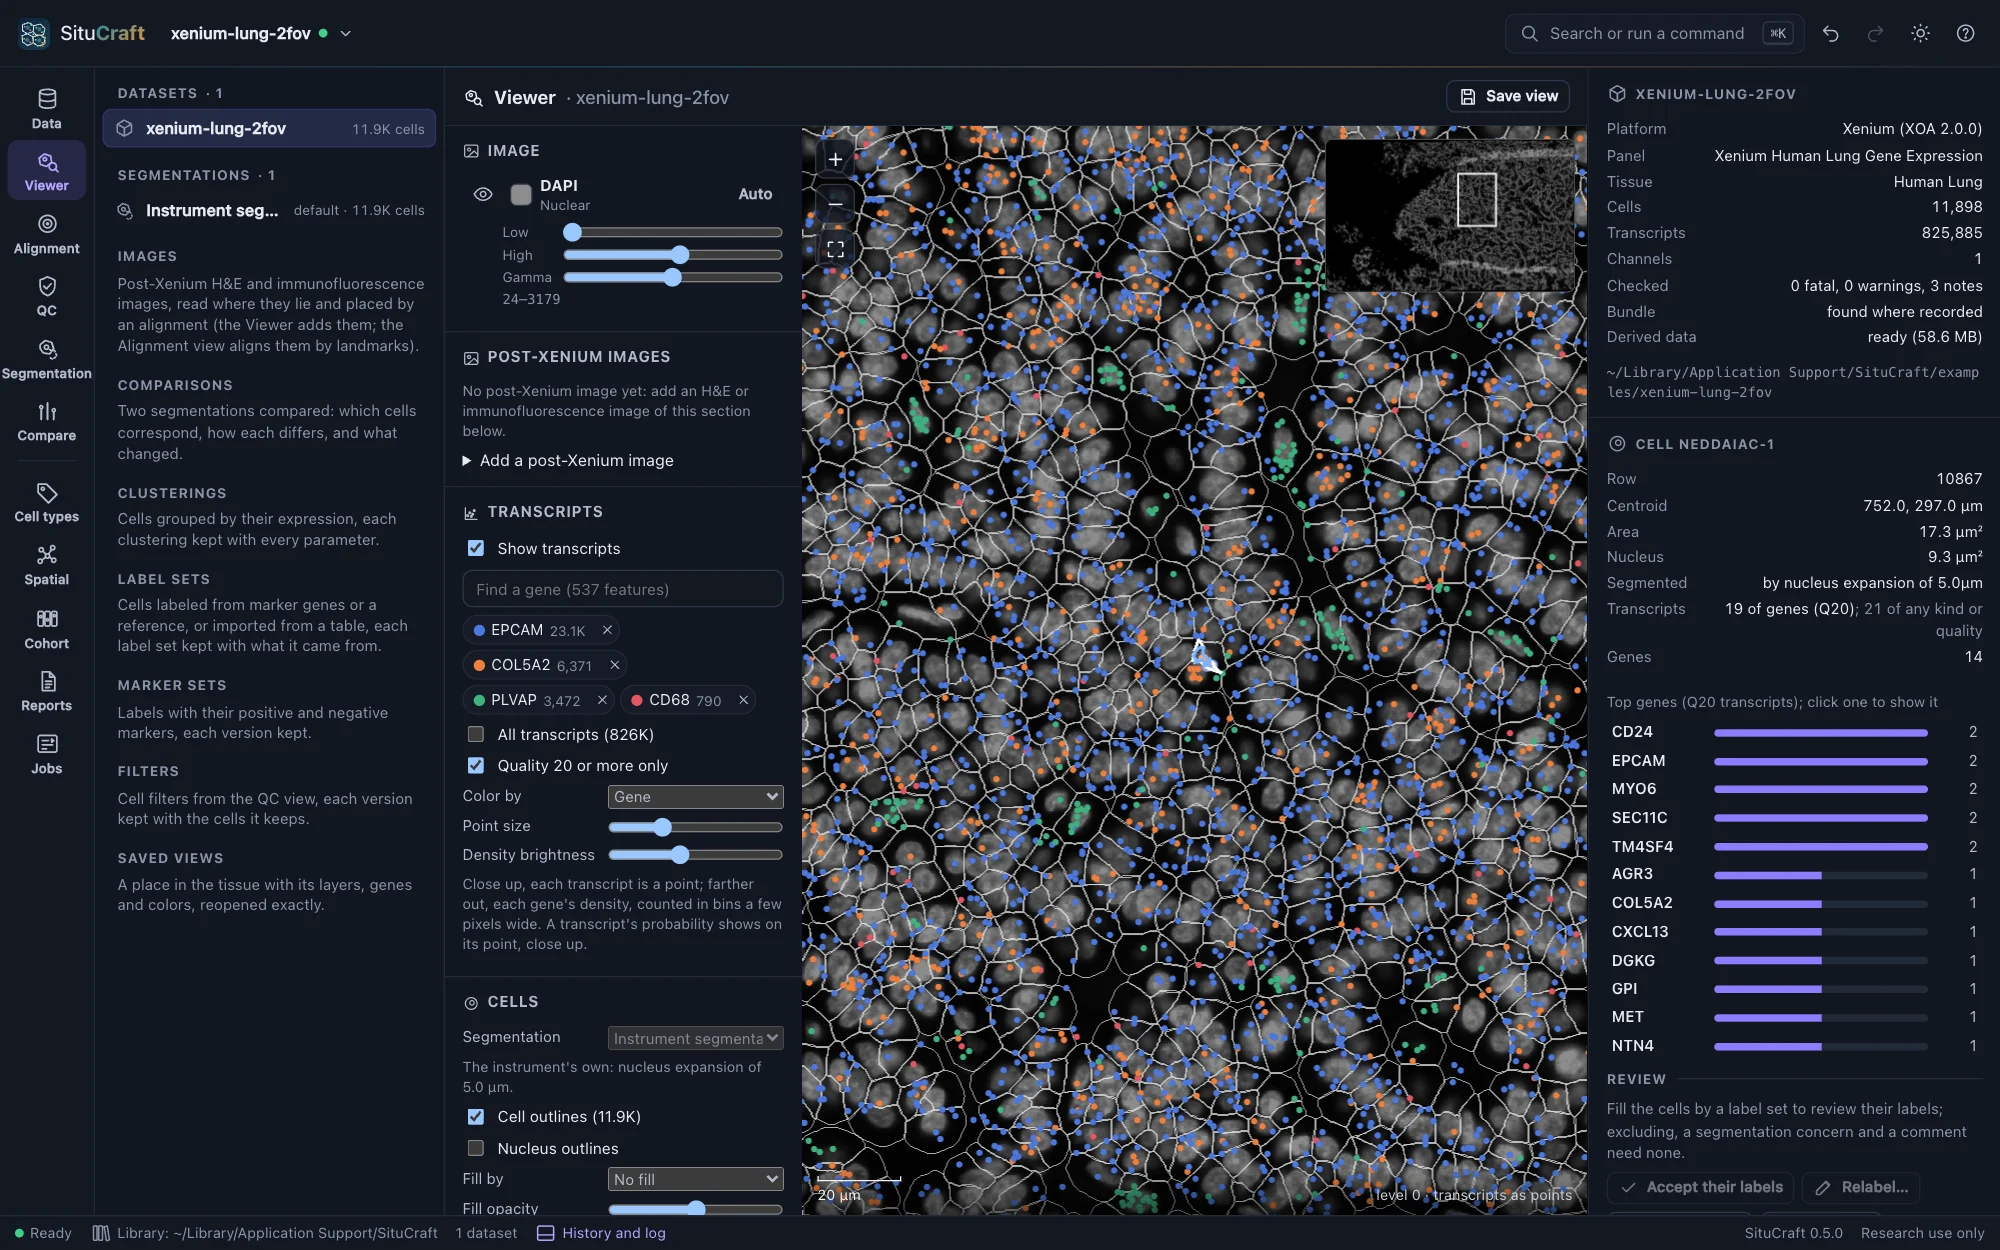
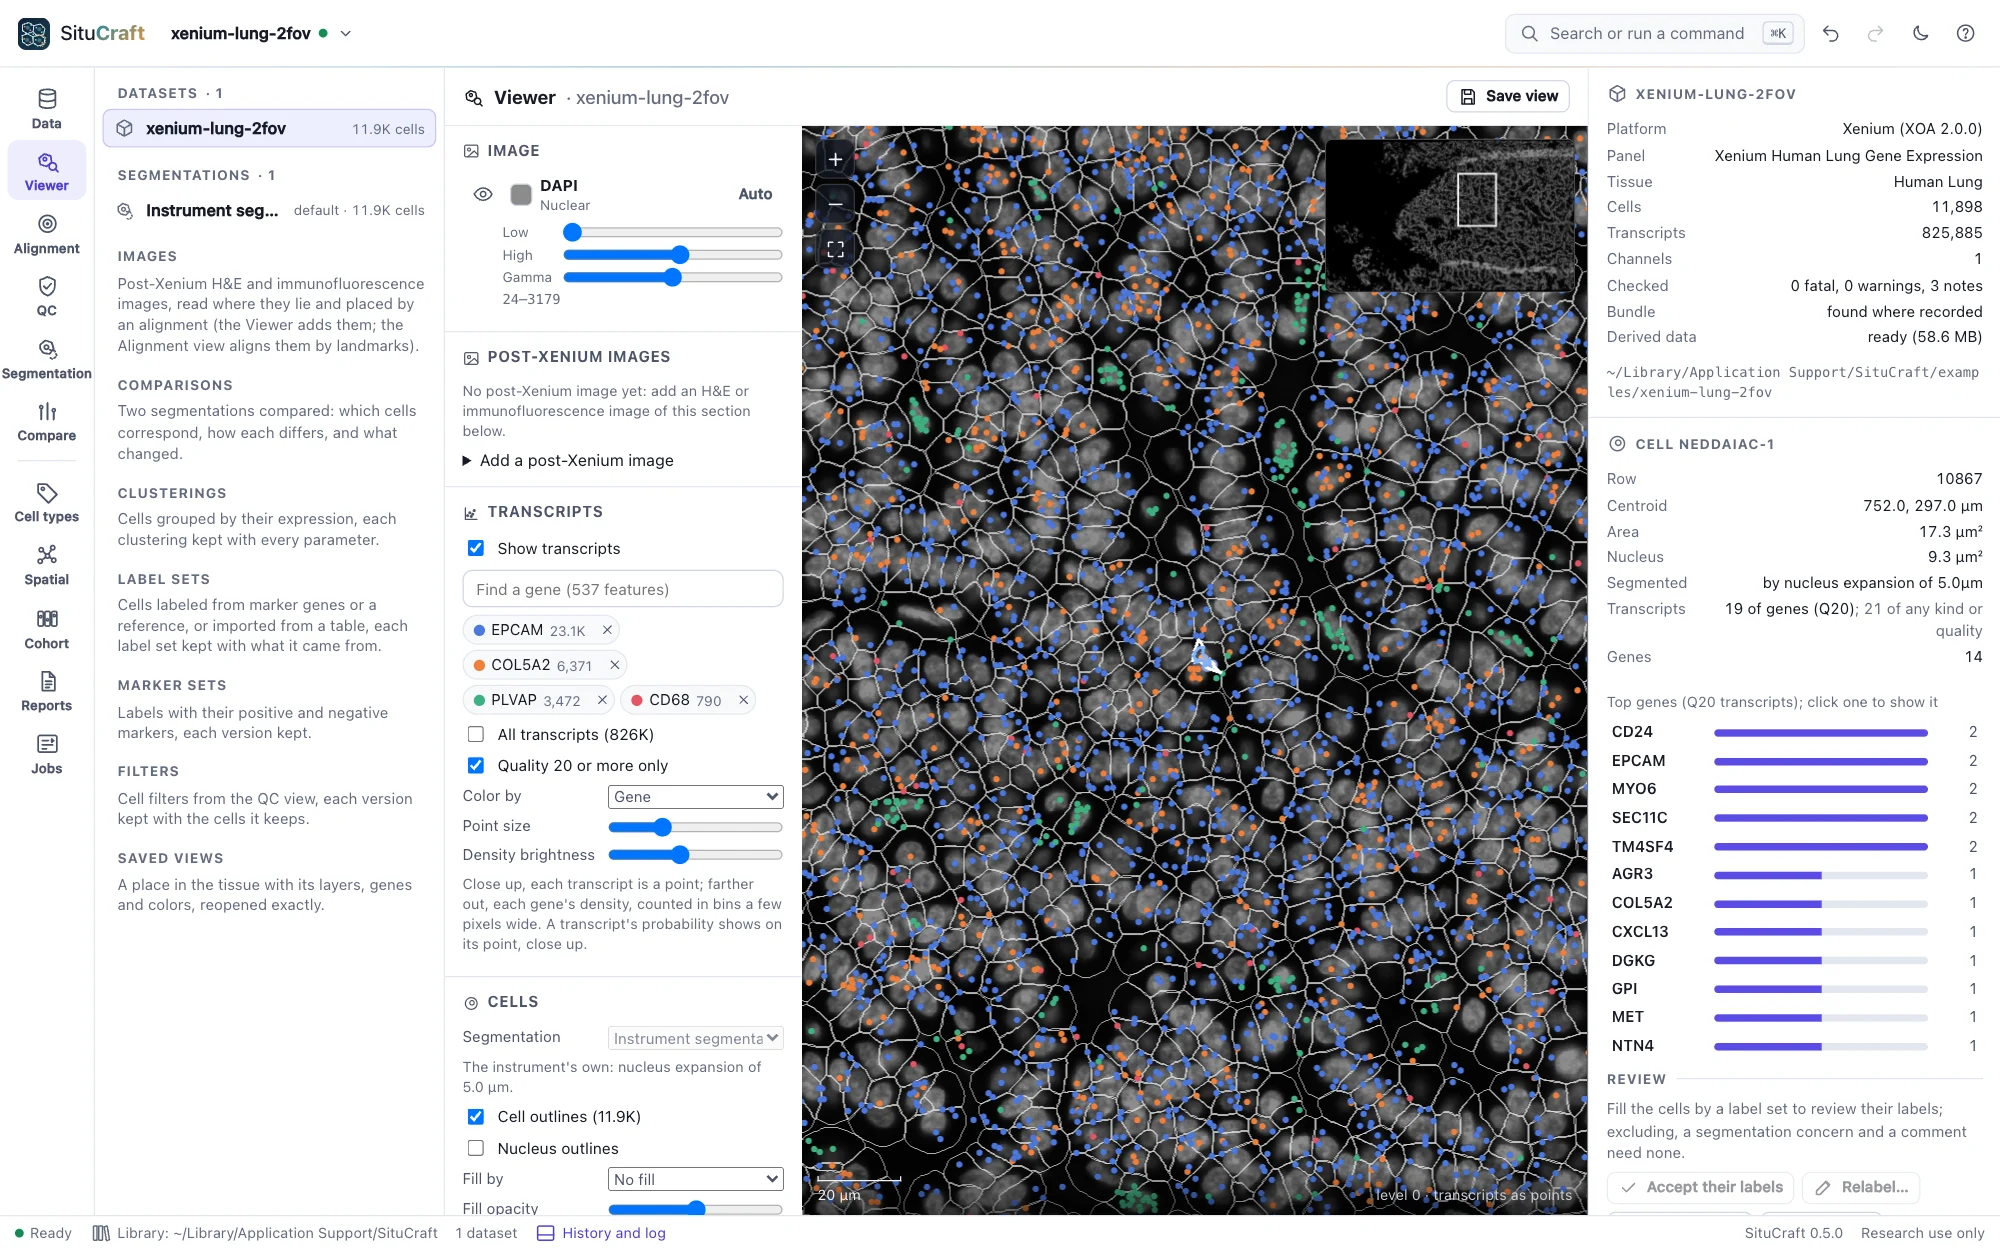
SituCraft's Viewer on the Lung example: transcripts of EPCAM, COL5A2, PLVAP and CD68 over the gray DAPI stain and the cells' outlines, a selected cell's transcripts by gene in the inspectorSituCraft's Viewer on the Lung example: transcripts of EPCAM, COL5A2, PLVAP and CD68 over the gray DAPI stain and the cells' outlines, a selected cell's transcripts by gene in the inspector
The Xenium human Lung section (10x Genomics, CC BY 4.0), one of the examples: four genes' transcripts over the DAPI stain and the cells, one cell in the inspector.
$ curl --proto '=https' --tlsv1.2 -fsSL https://raw.githubusercontent.com/robert-mcdermott/situcraft/main/install.sh | sh

Installs the latest release in ~/.local/bin after checking its SHA-256 checksum, then prints how to start it. Other options

Free and open source (Apache 2.0) · macOS, Linux and Windows · x64 and ARM64 · for research use

Checked from the bundle up

Every file read by SituCraft's own readers and checked against independent ones; each bundle checked before use, with 22 of the run's recorded values recomputed from its data; every image sample drawn exactly as recorded.

Segmentation you can question

Cells are the unit everything else counts. Make them again from the transcripts, compare any two segmentations cell by cell, see which cells' labels and which analyses the choice changes, and record the decision.

Private and self-contained

One program for macOS, Linux and Windows. Bundles are read where they are and never changed; nothing is uploaded, and the only request SituCraft makes is an example's download, when you ask.

On the record

Every result an artifact with its lineage, parameters, seed and checksums; the same settings give the same bytes on any computer; decisions and reviews appended, never removed; what made a result, and a methods section written from it with its references.

What it does

From the instrument's bundle to results others can check

Open a Xenium bundle, check it, look at the tissue, decide which cells to trust, name them, bring in the pathology, ask which cells are neighbors and where, compare groups of subjects, and write it up so that others can check it, each step kept on record.

Open and check

A bundle checked before it is used

SituCraft opens a Xenium output bundle as a folder, a zip or its experiment.xenium, says what it is and how far it is supported, and checks it: each finding fatal, a warning or a note, with the files it concerns, where in the tissue, and what to do.

  • 22 of the run's recorded values recomputed from its data
  • Thirteen broken bundles, each raising exactly its findings
  • Derived data built once and reused: image tiles, a transcript index, tiled outlines
Opening a bundle
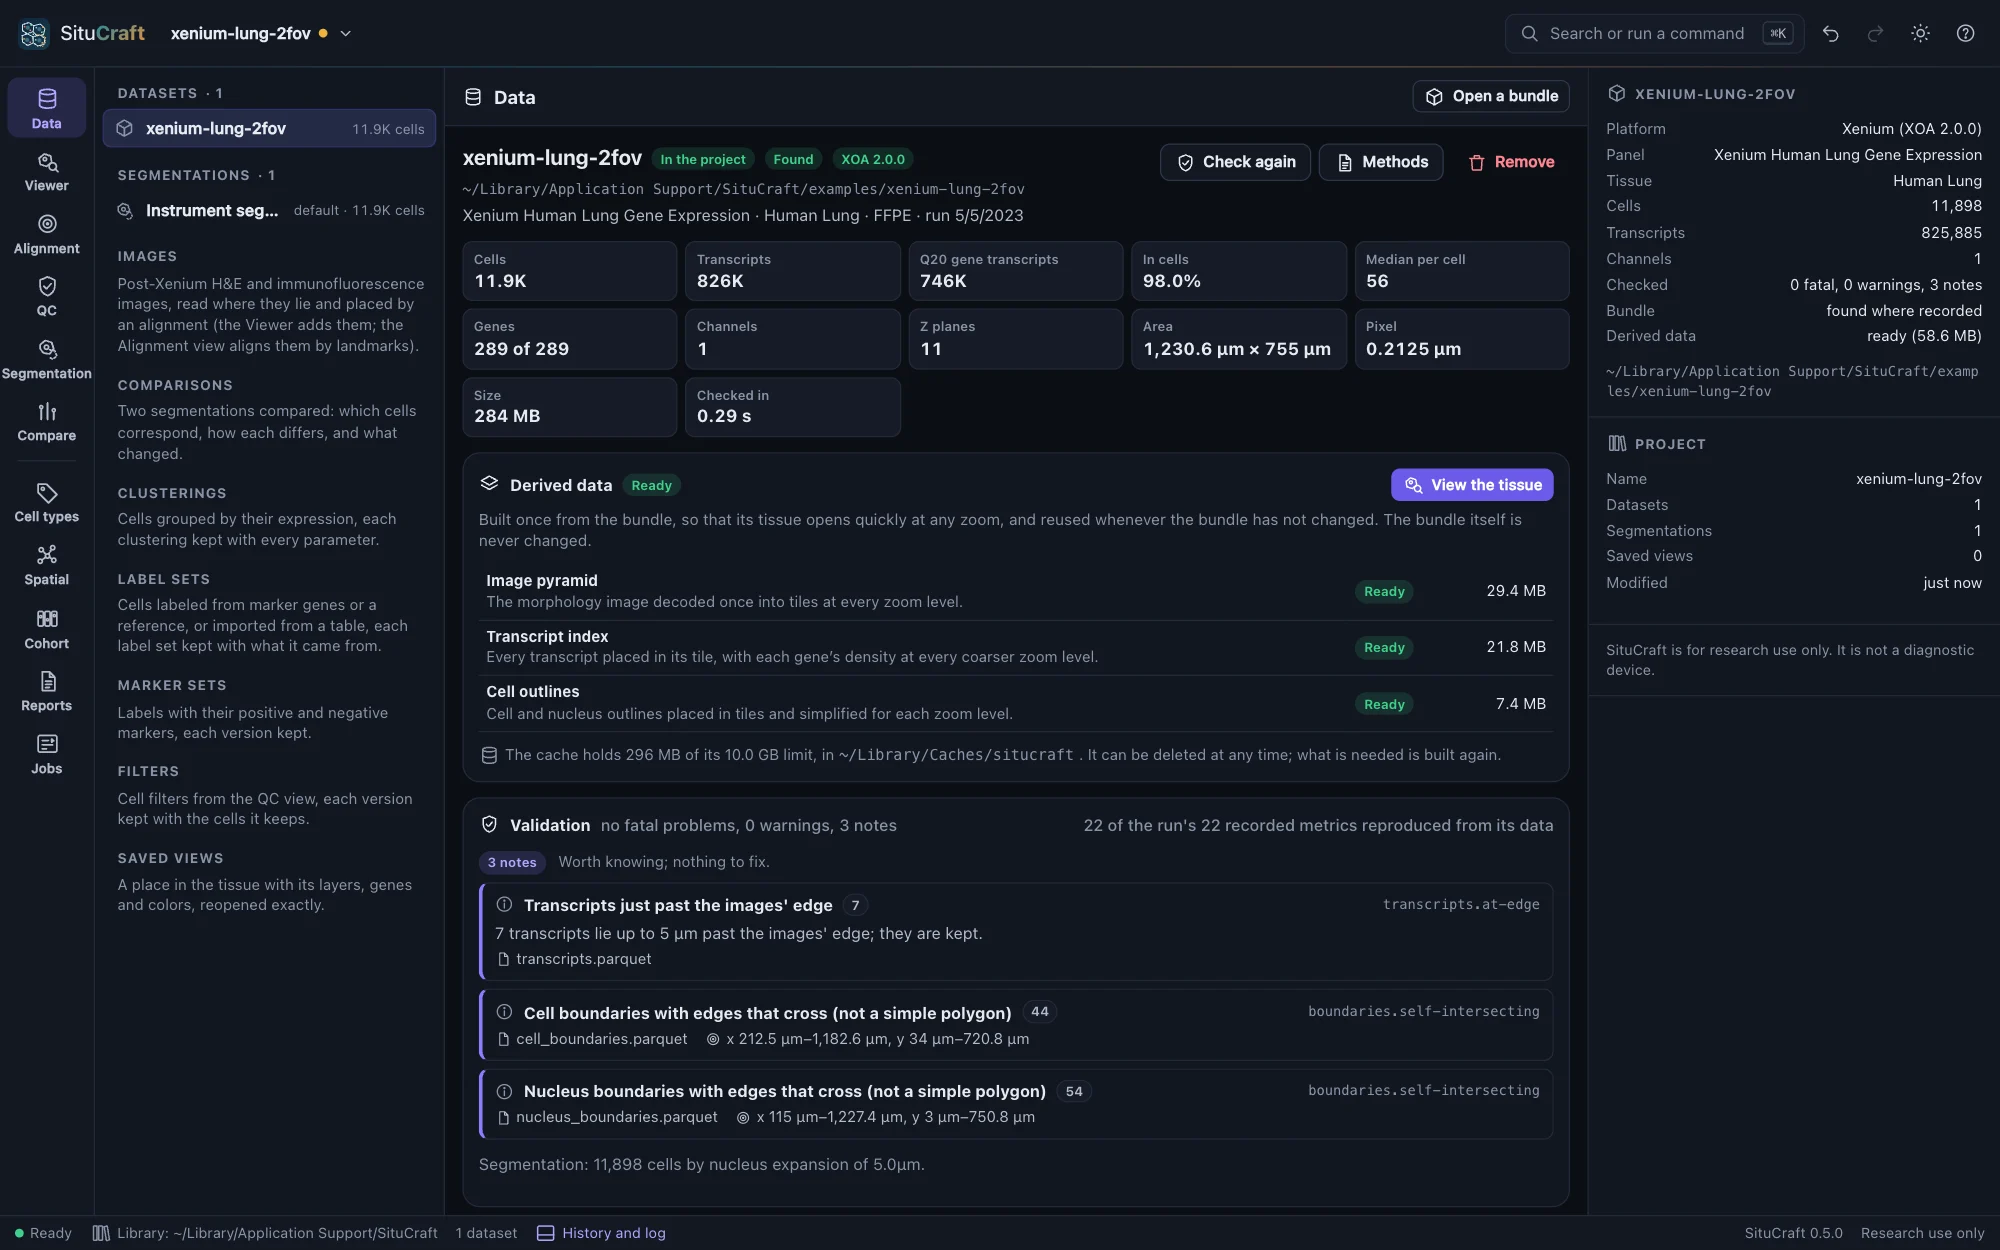
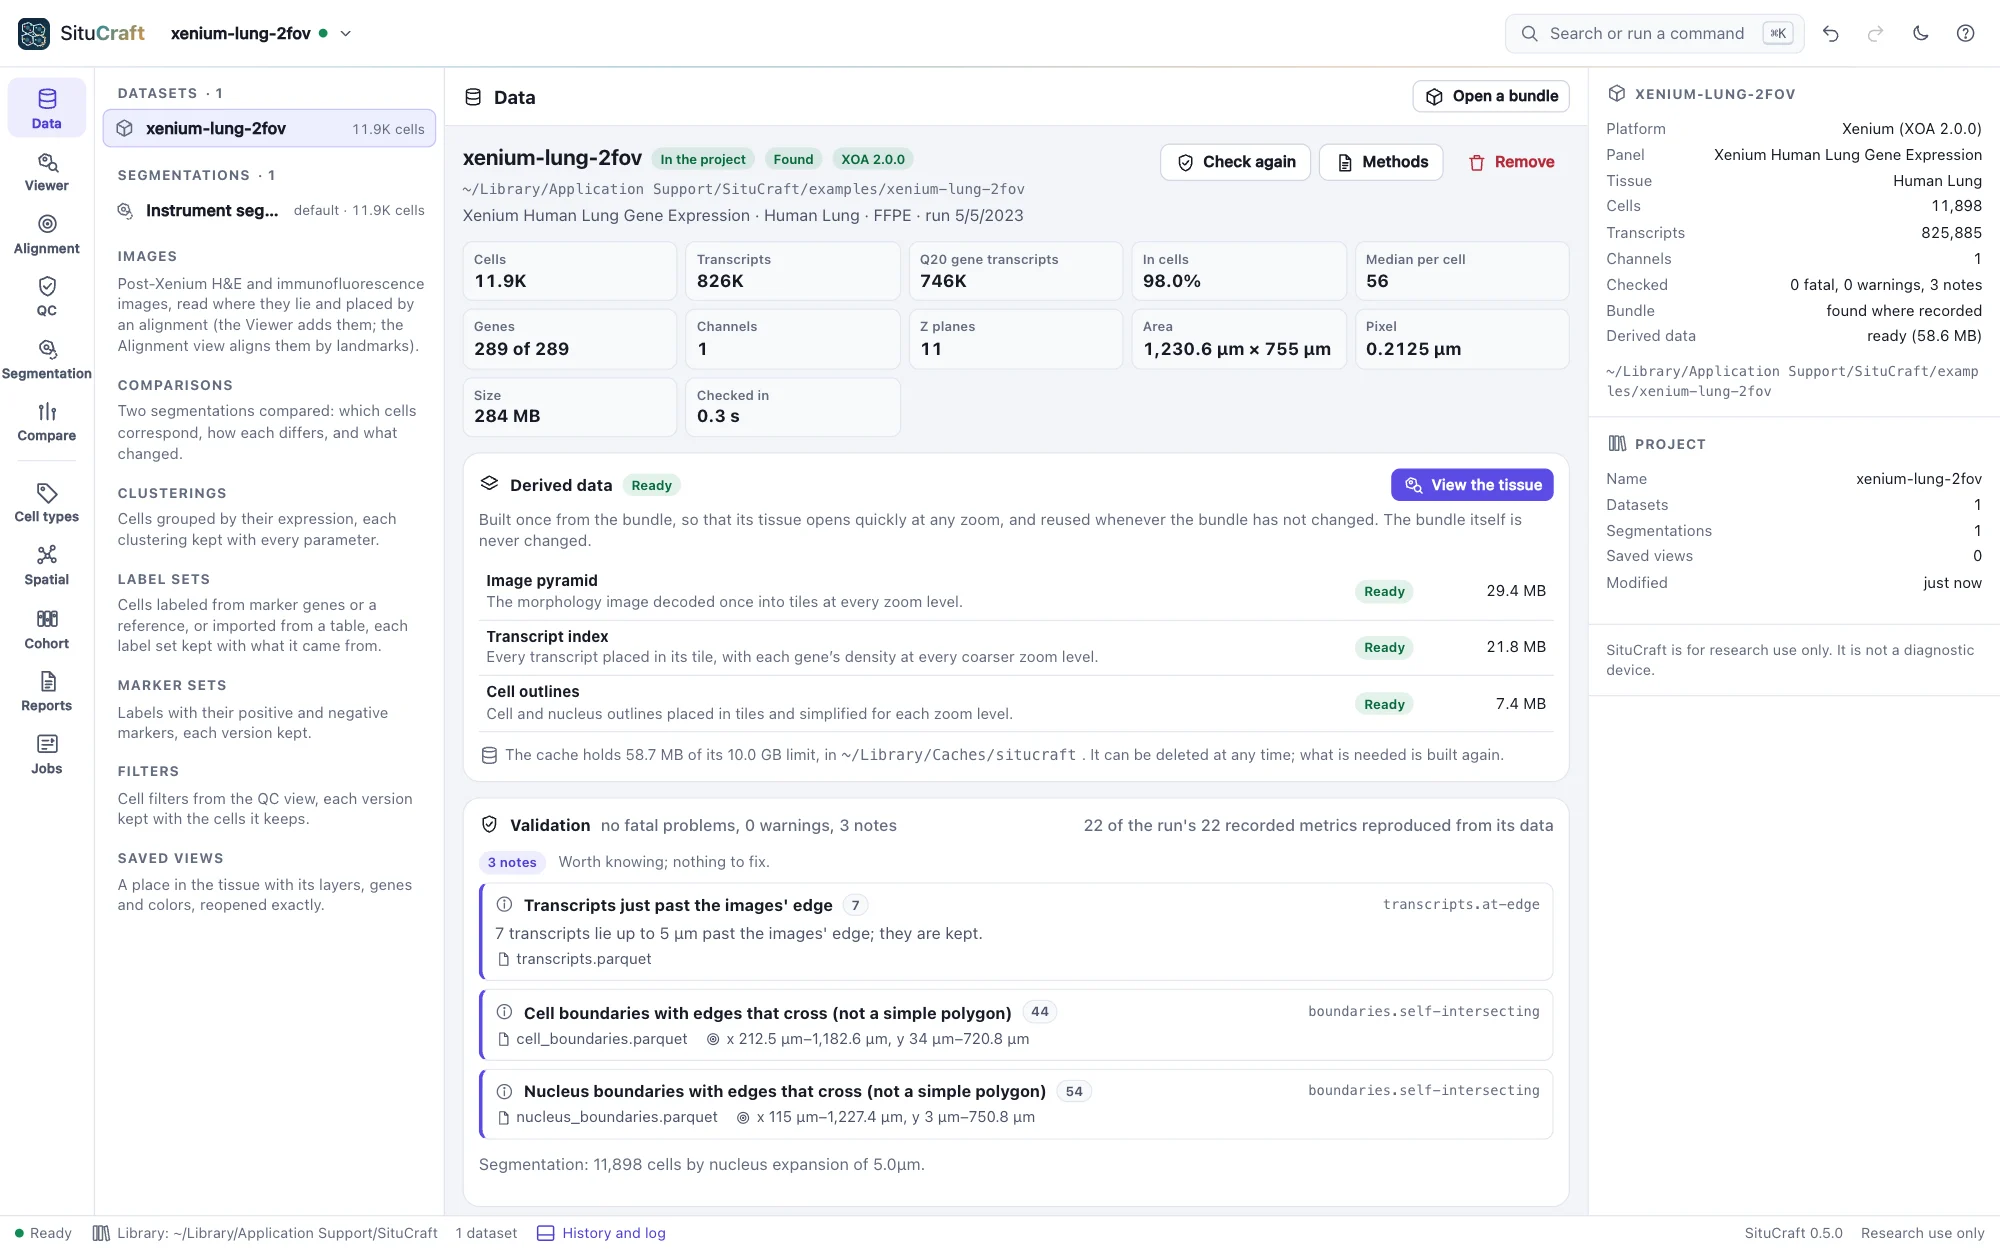
The Data view of the Lung example: the run's facts, its derived data built, and the check's three notesThe Data view of the Lung example: the run's facts, its derived data built, and the check's three notes
The Lung example checked: what the run was, its derived data, and three notes.
The tissue and QC

Every sample as recorded, quality where it is

The Viewer draws the stains, the transcripts of up to 16 genes and the cells of any segmentation at any zoom, reading the data by tile. The QC view explains every metric the run recorded beside its recomputed value, maps quality over the tissue, and keeps cell filters as versions that never change the data.

  • Plots whose chosen cells light up in the tissue
  • Saved views and links that reopen exactly
  • Filters checked to keep the same cells whenever the project reopens
Quality control
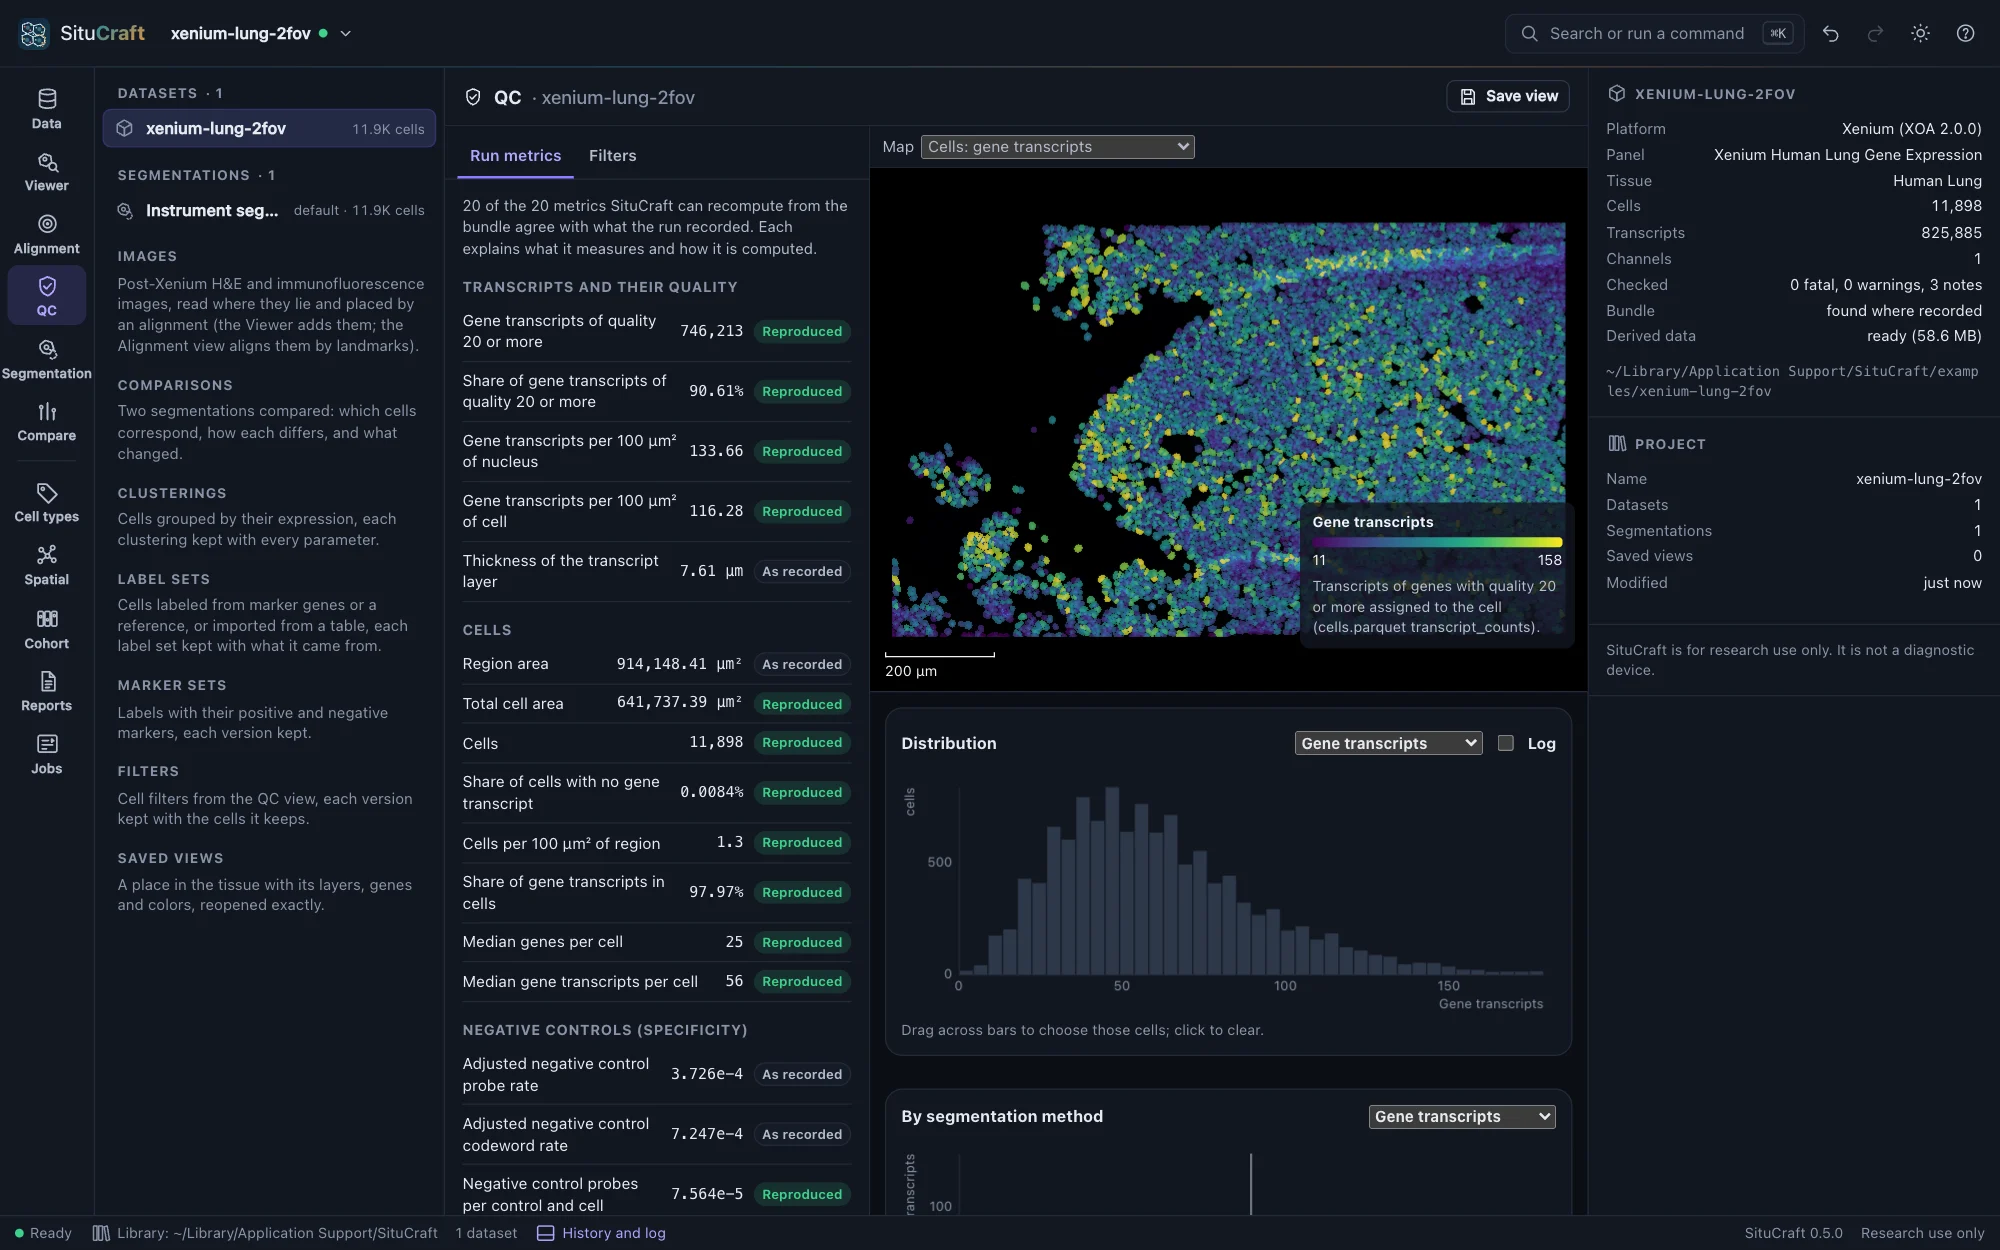
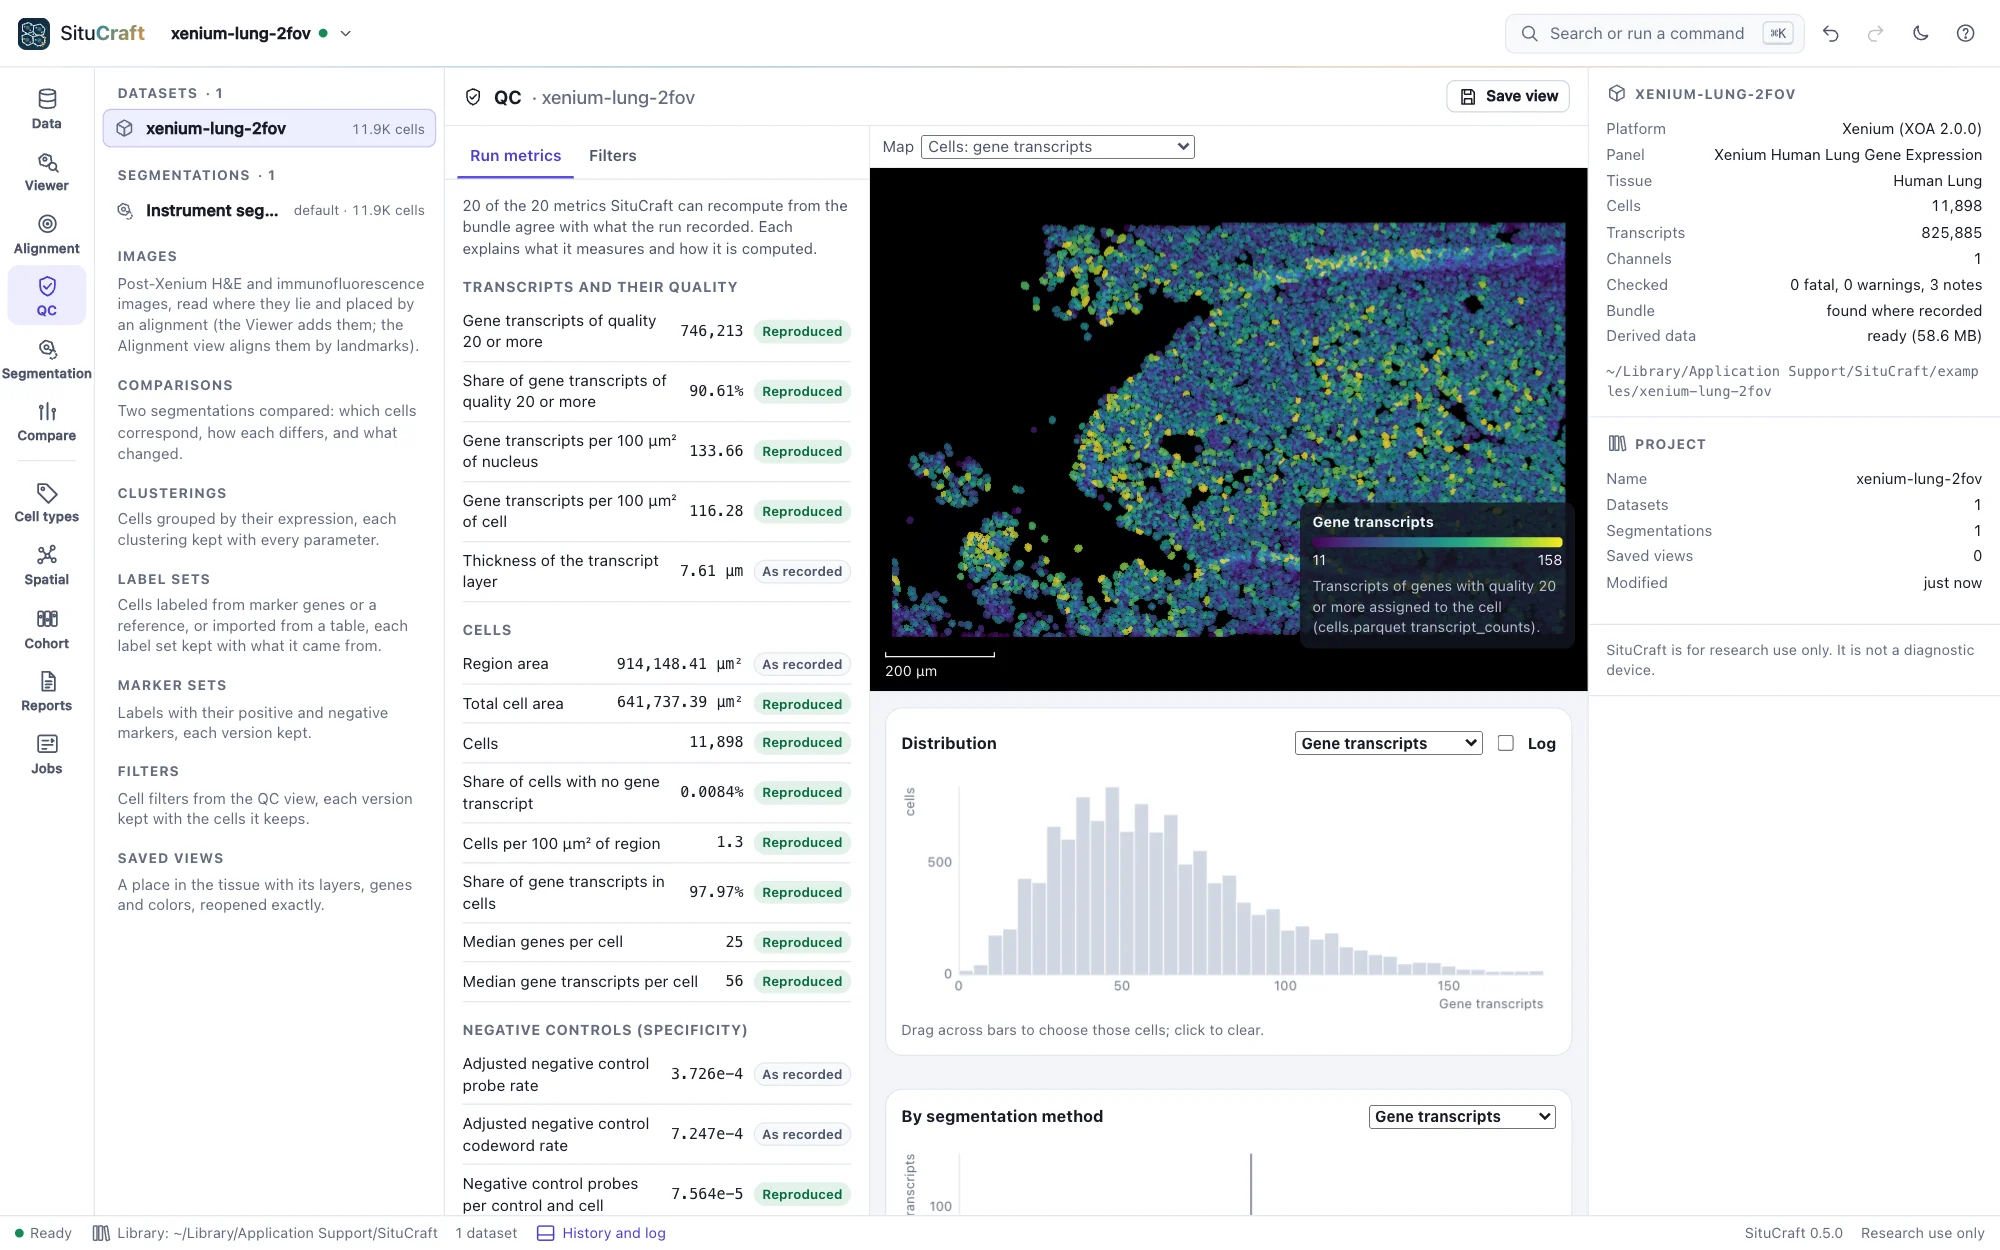
SituCraft's QC view of the Lung example: the run's metrics with SituCraft's recomputed values, cells colored by their gene transcripts, and a histogramSituCraft's QC view of the Lung example: the run's metrics with SituCraft's recomputed values, cells colored by their gene transcripts, and a histogram
The Lung run's metrics, recomputed from the data and reproduced.
Segmentations

Cells made, compared and decided

Expand the nuclei, import another tool's cells, or let SituCraft redraw each cell from its transcripts (after Jones et al. 2025), in a studio that says what a run needs before it starts. Any two segmentations are compared cell by cell, with measures of transcripts given to the wrong cell, and a workspace ranks their differences for review.

  • On simulated truth, 84.7% of transcripts in their true cell, against the instrument's 82.2%
  • Imports from SpatialData, Baysor, GeoJSON and Xenium Ranger
  • Exports to SpatialData, AnnData, Parquet, CSV, Matrix Market, GeoJSON and Xenium Ranger
  • Decisions kept with the comparison they rest on; no segmentation ever deleted
Comparing and deciding
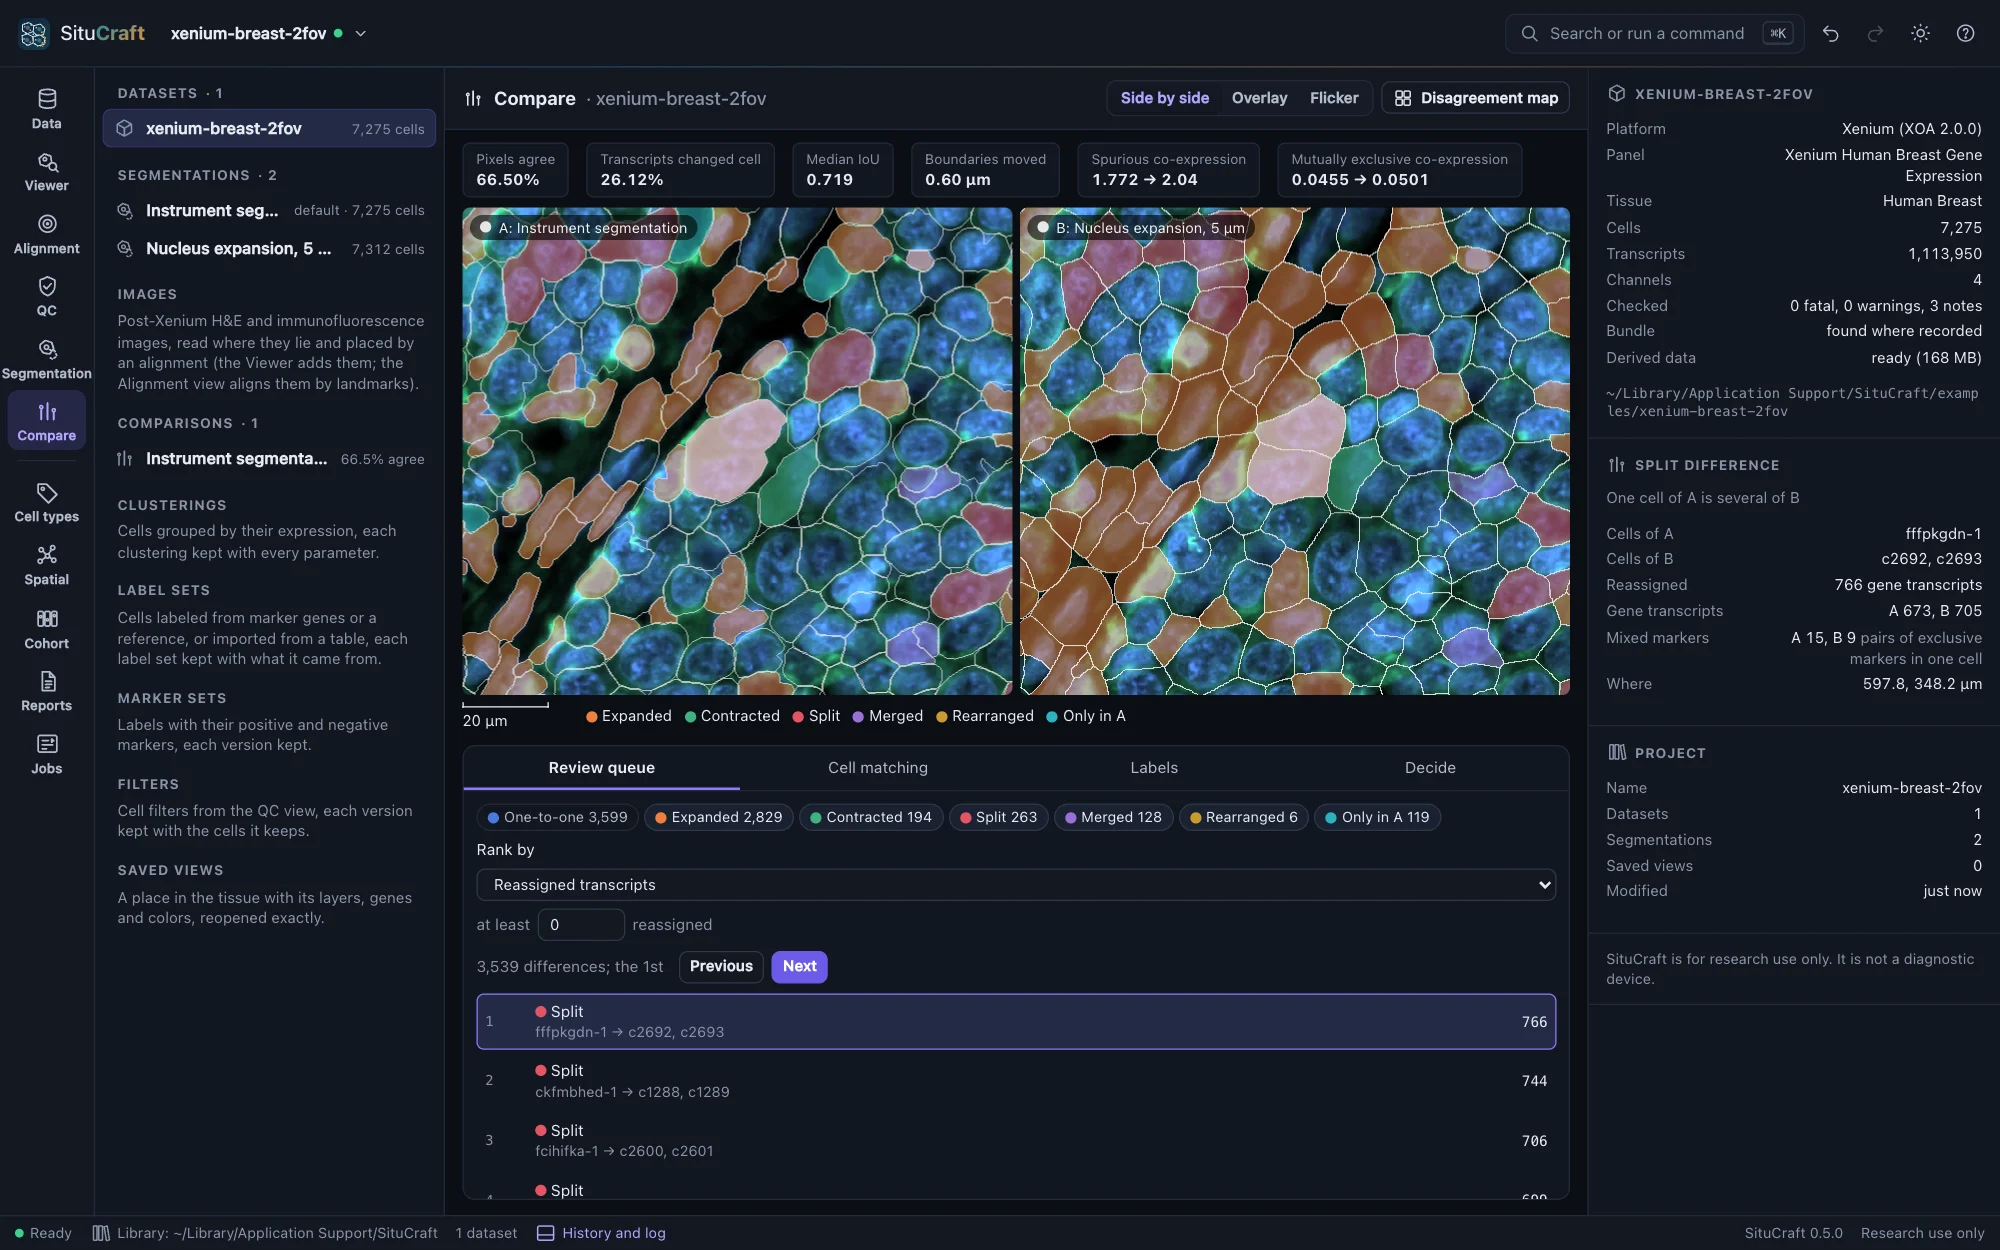
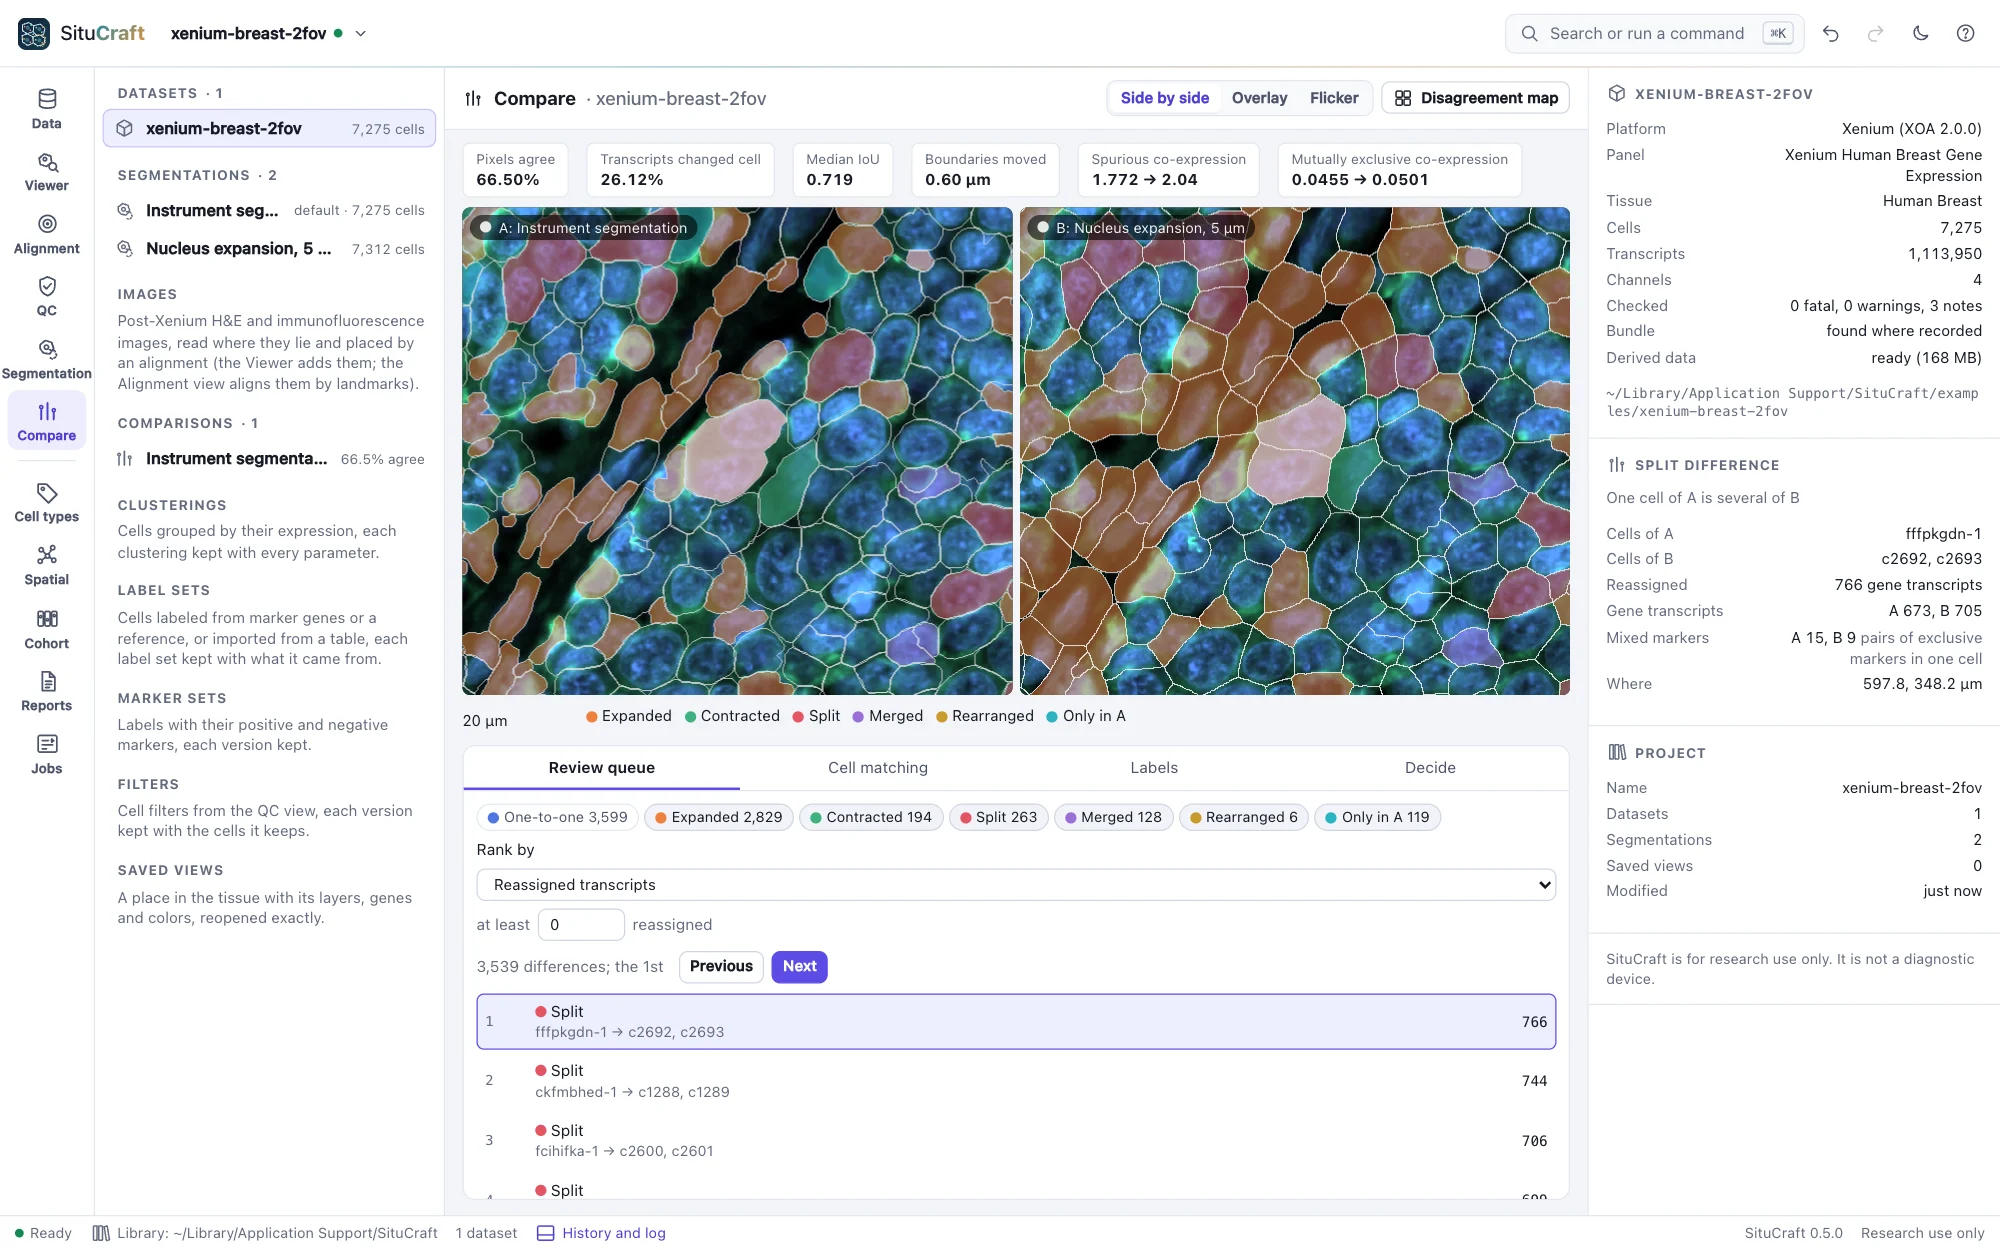
The Compare workspace: the Breast example's instrument segmentation and a 5 µm nucleus expansion side by side on the tissue, cells filled by the class of their difference, the review queue's first split chosen and described in the inspectorThe Compare workspace: the Breast example's instrument segmentation and a 5 µm nucleus expansion side by side on the tissue, cells filled by the class of their difference, the review queue's first split chosen and described in the inspector
Two segmentations of the Breast section with one camera, their differences ranked for review.
Cell types

Clusters, labels and their evidence

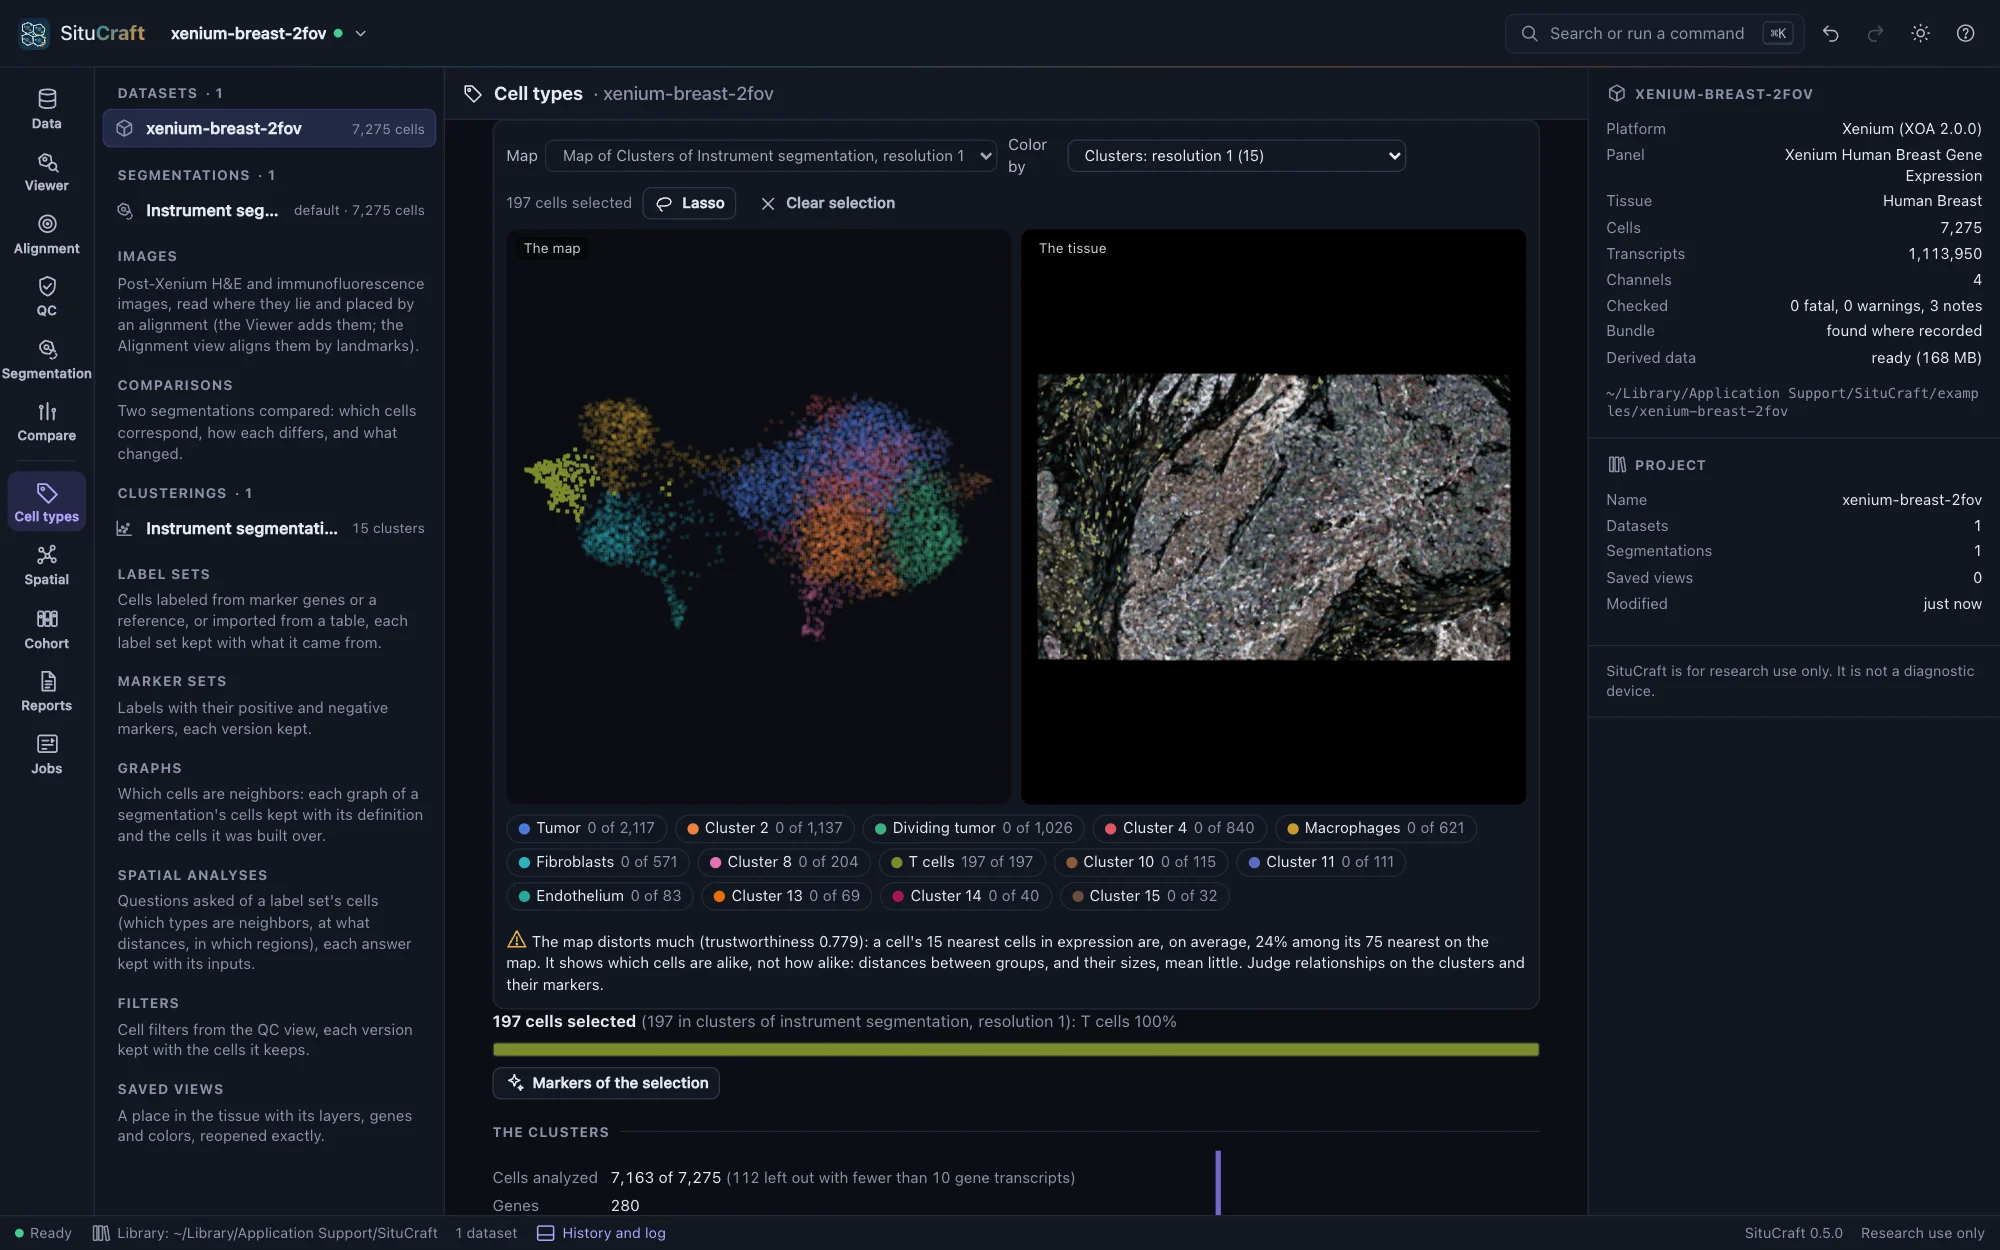
Cluster a segmentation's cells as scanpy does, see them on a map linked to the tissue, and label them from marker genes, from a labeled single-cell reference, or from a table made elsewhere. Labels are predictions: each cell's evidence is a click away, and a review queue ranks the cells most worth a look.

  • Starter marker sets for the examples' panels, from published atlases
  • Curated and consensus label sets as versions beside the predicted ones
  • The labels read under two segmentations: which cells the choice changes
Labels
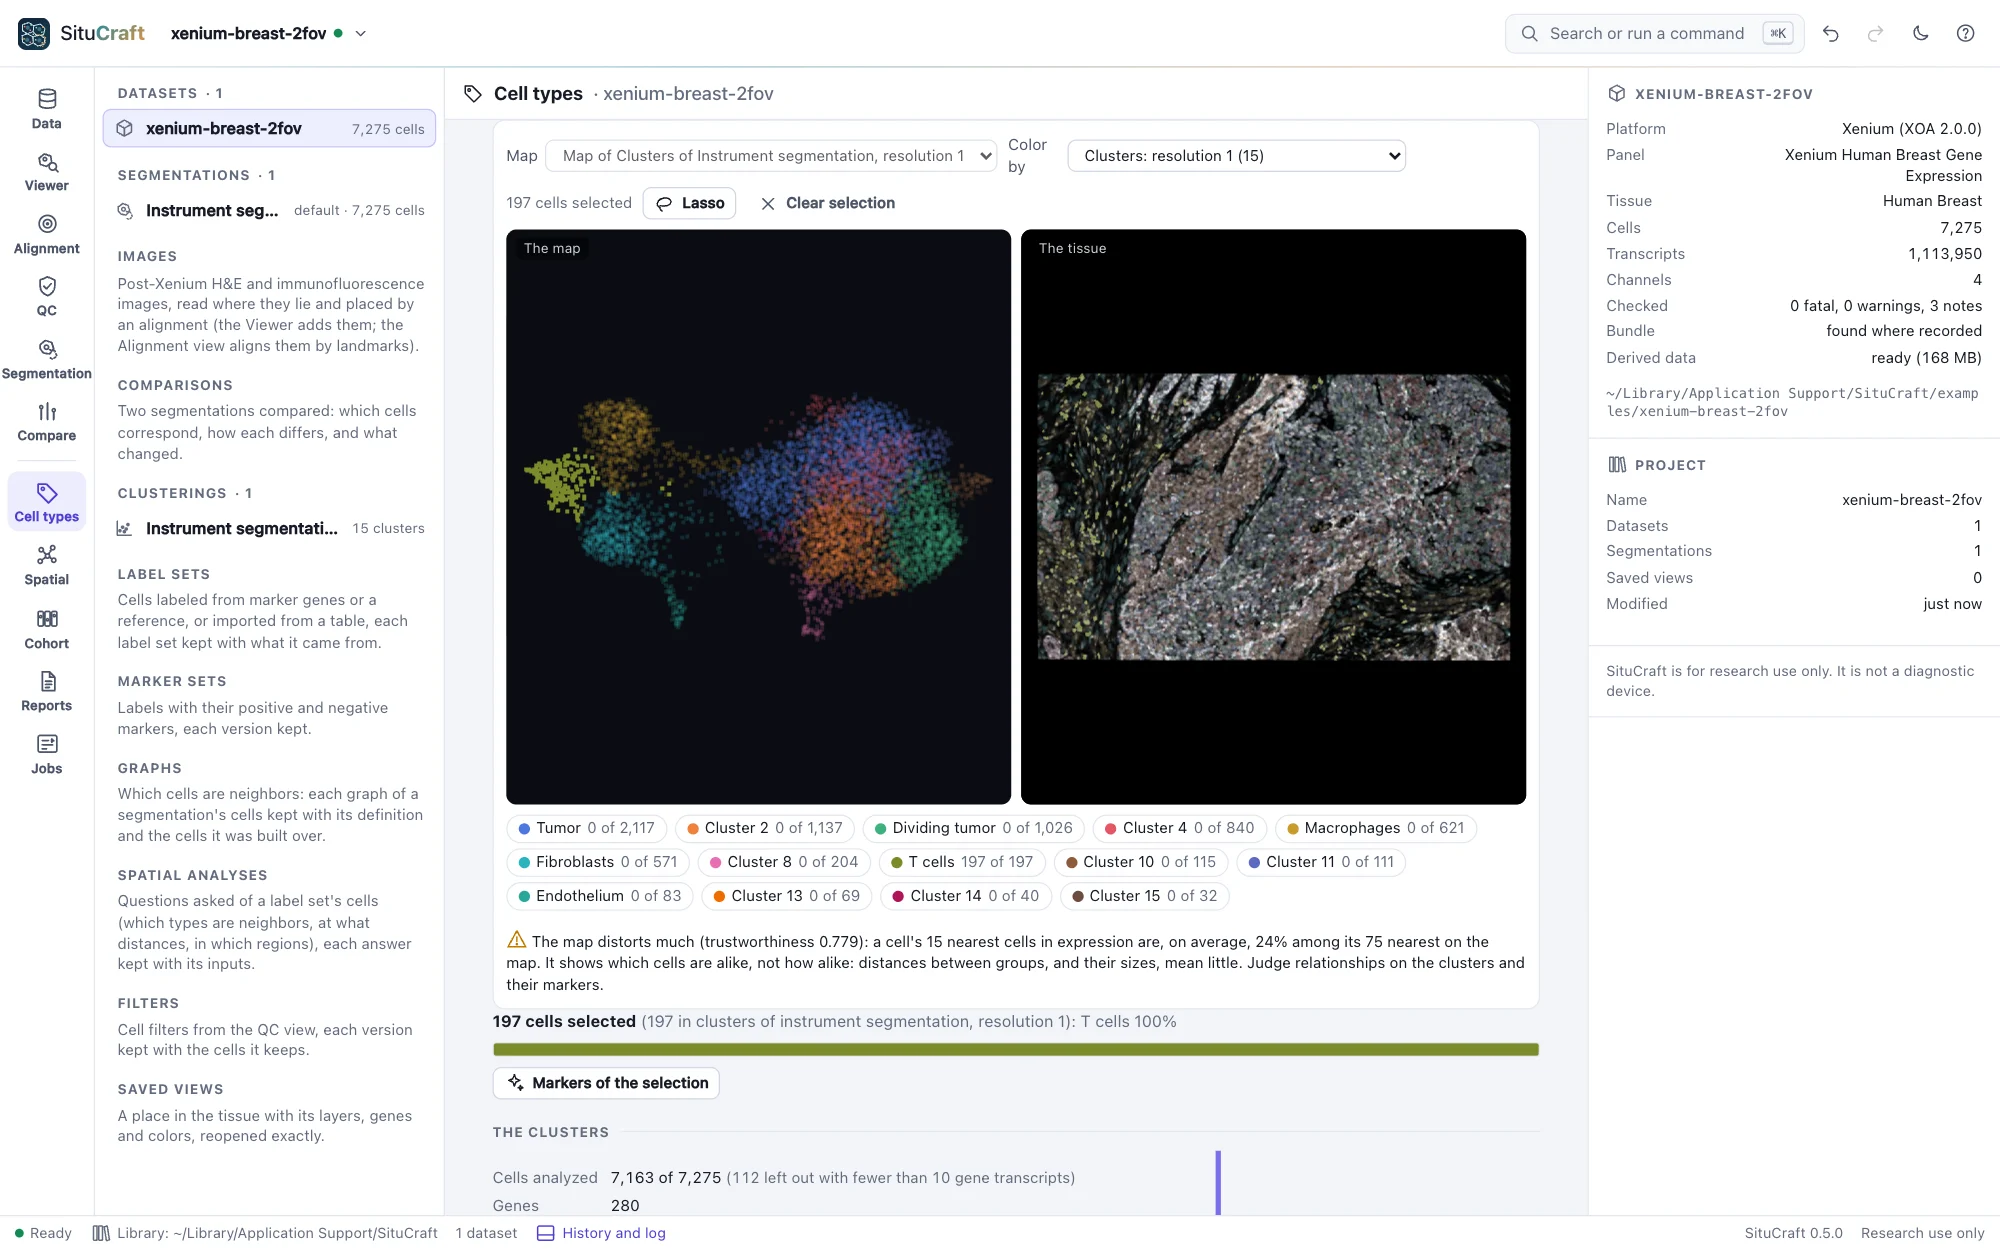
The Cell types view of the Breast example: the map of the cells (UMAP) beside the tissue, colored by cluster, the T cells selected on the map and lit on the tissue, and a note saying how faithful the map isThe Cell types view of the Breast example: the map of the cells (UMAP) beside the tissue, colored by cluster, the T cells selected on the map and lit on the tissue, and a note saying how faithful the map is
The Breast cells' map beside the tissue, linked: the T cells selected on both.
The pathology bridge

The H&E on the tissue, placed in µm

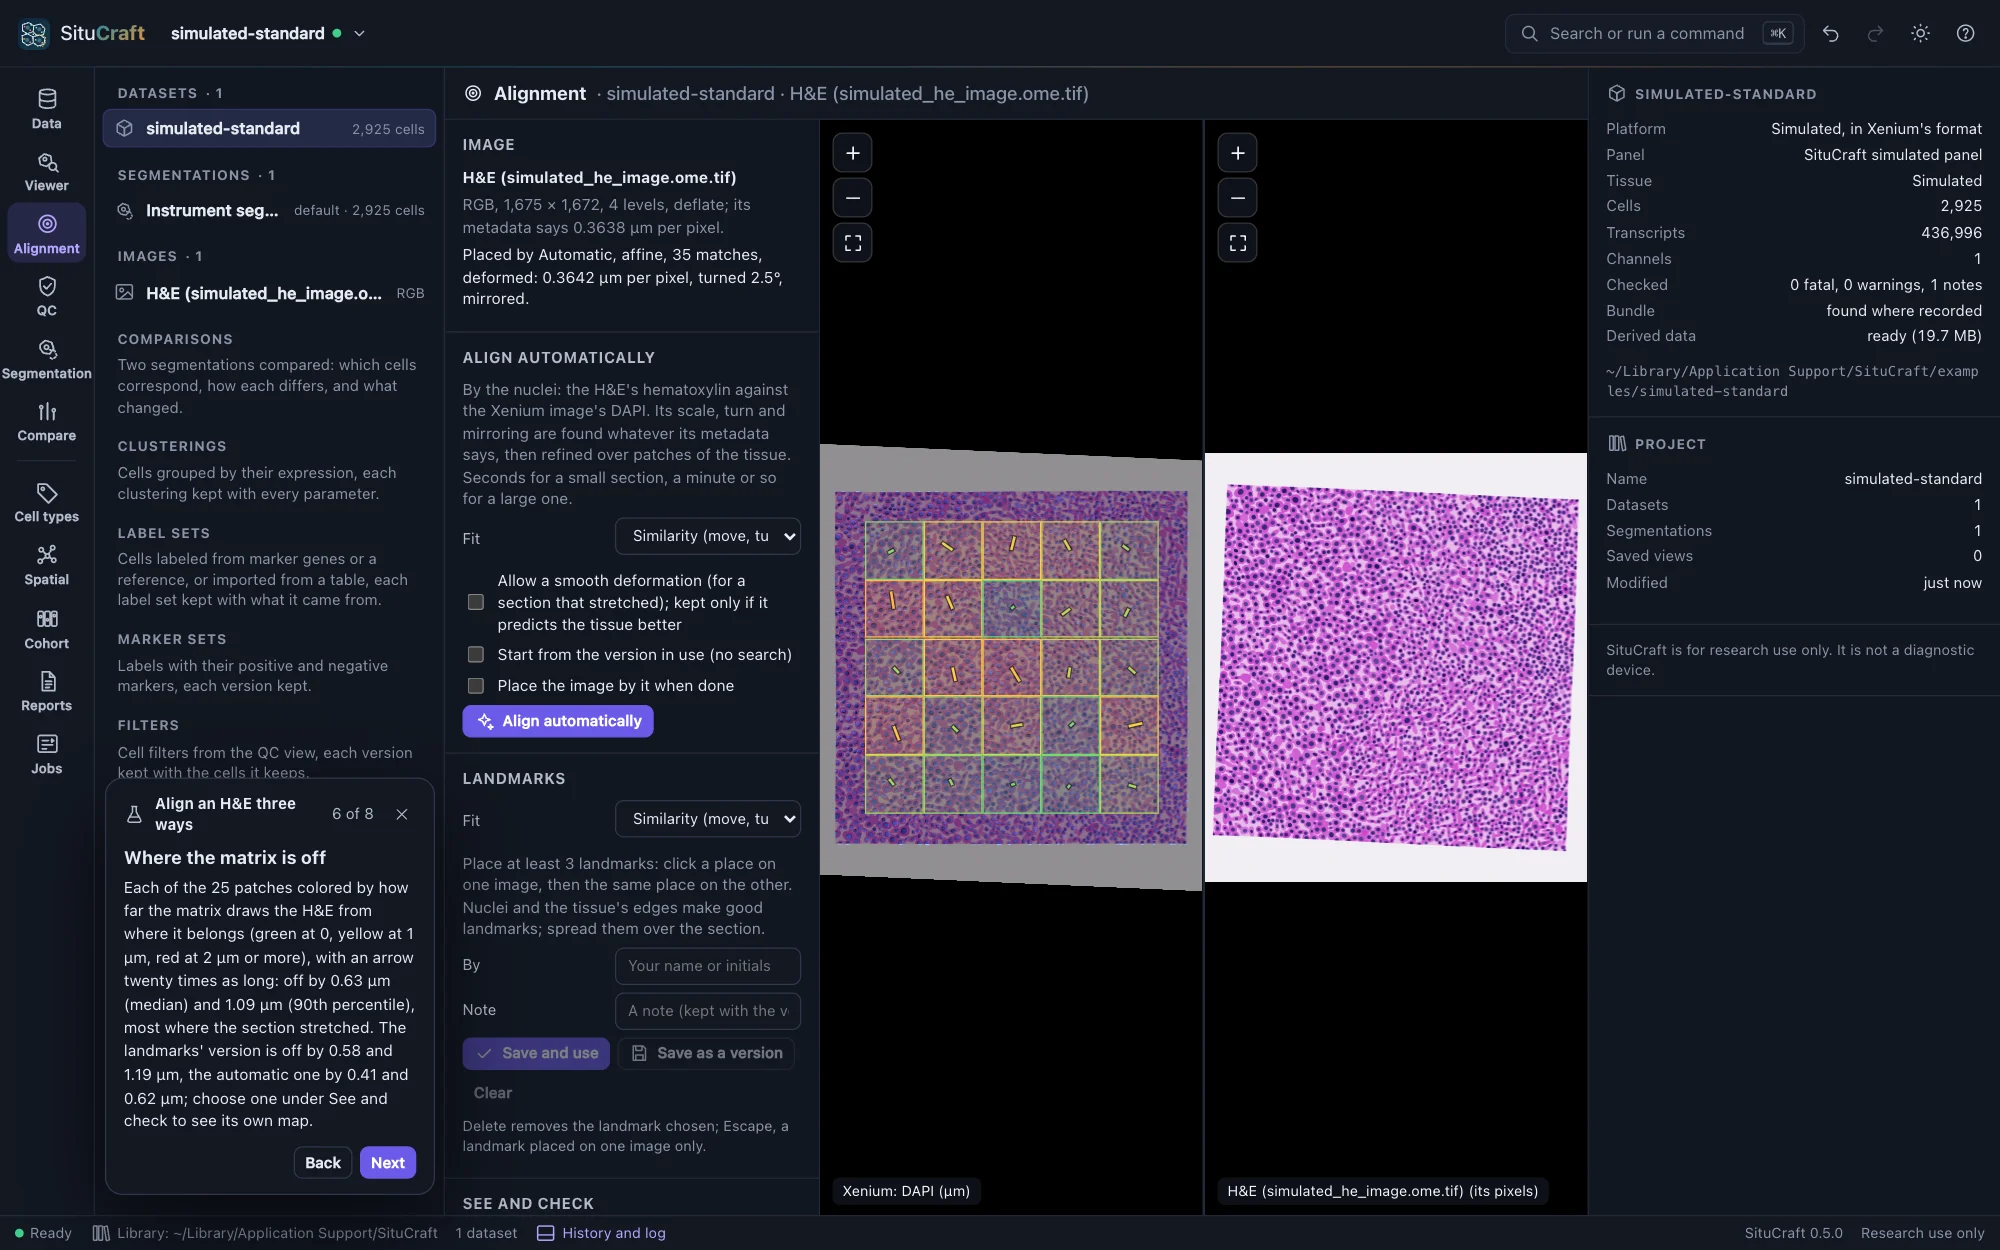
Post-Xenium H&E and immunofluorescence images are drawn under the transcripts and cells, placed by Xenium Explorer's alignment, by landmarks, or automatically by their nuclei, and checked over the whole section in µm. Regions drawn on any image go to QuPath and back; reviews record each decision with what was on screen.

  • Alignments as versions, each with how well it fits and who made it
  • Regions in QuPath's GeoJSON, in the pixels of the image you open there
  • A review record as CSV or JSON, never changed
Images and alignment
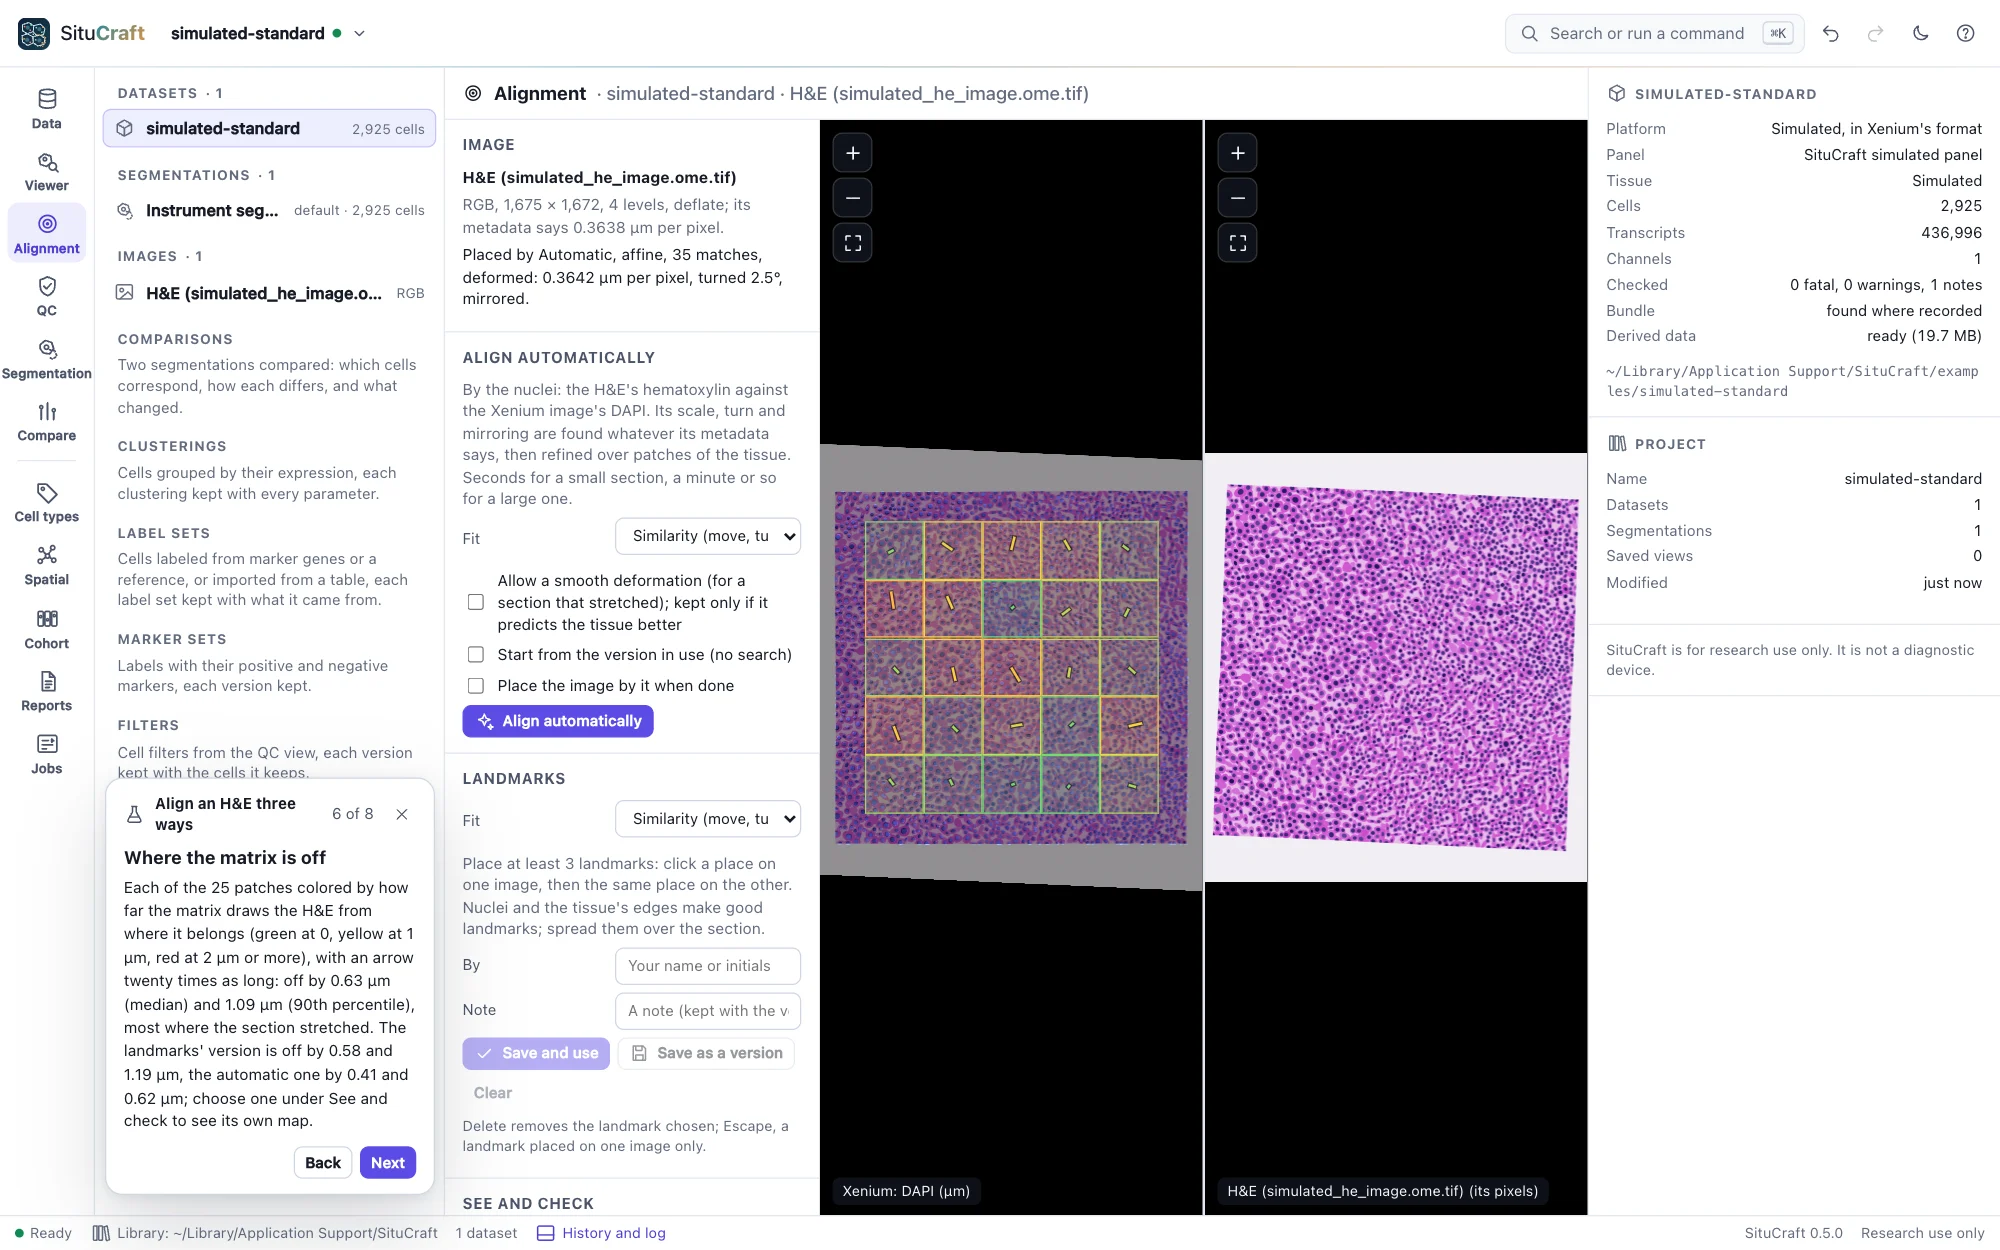
The Alignment view on the simulated tissue's H&E: on the left the Xenium image with the H&E placed over it by Xenium Explorer's matrix and each checked patch drawn as a square colored by how far off the matrix is there, on the right the H&E itselfThe Alignment view on the simulated tissue's H&E: on the left the Xenium image with the H&E placed over it by Xenium Explorer's matrix and each checked patch drawn as a square colored by how far off the matrix is there, on the right the H&E itself
The simulated H&E placed by its matrix, each checked patch colored by how far off it is.
Spatial analysis

How the tissue is organized

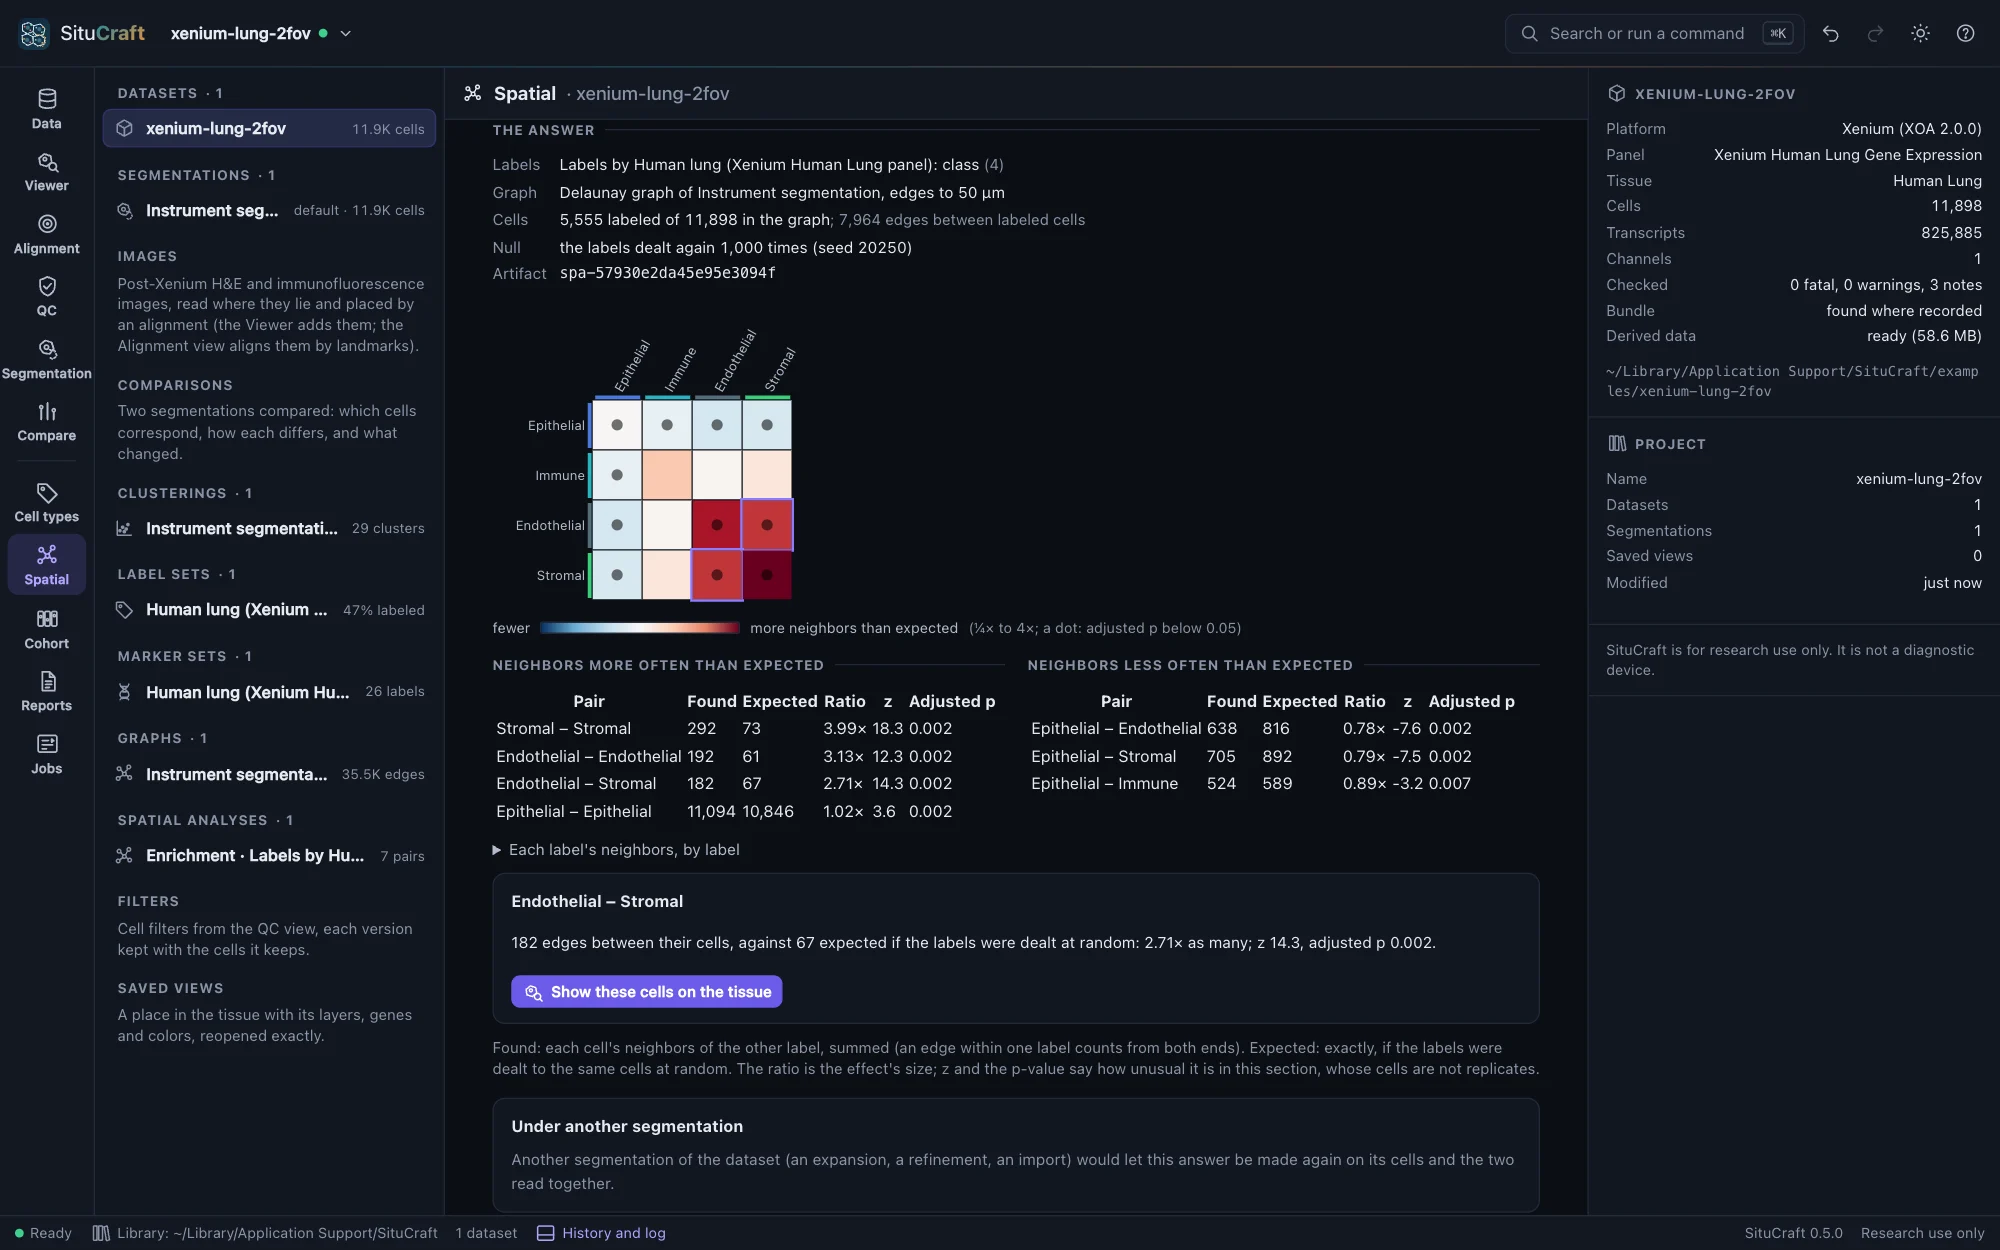
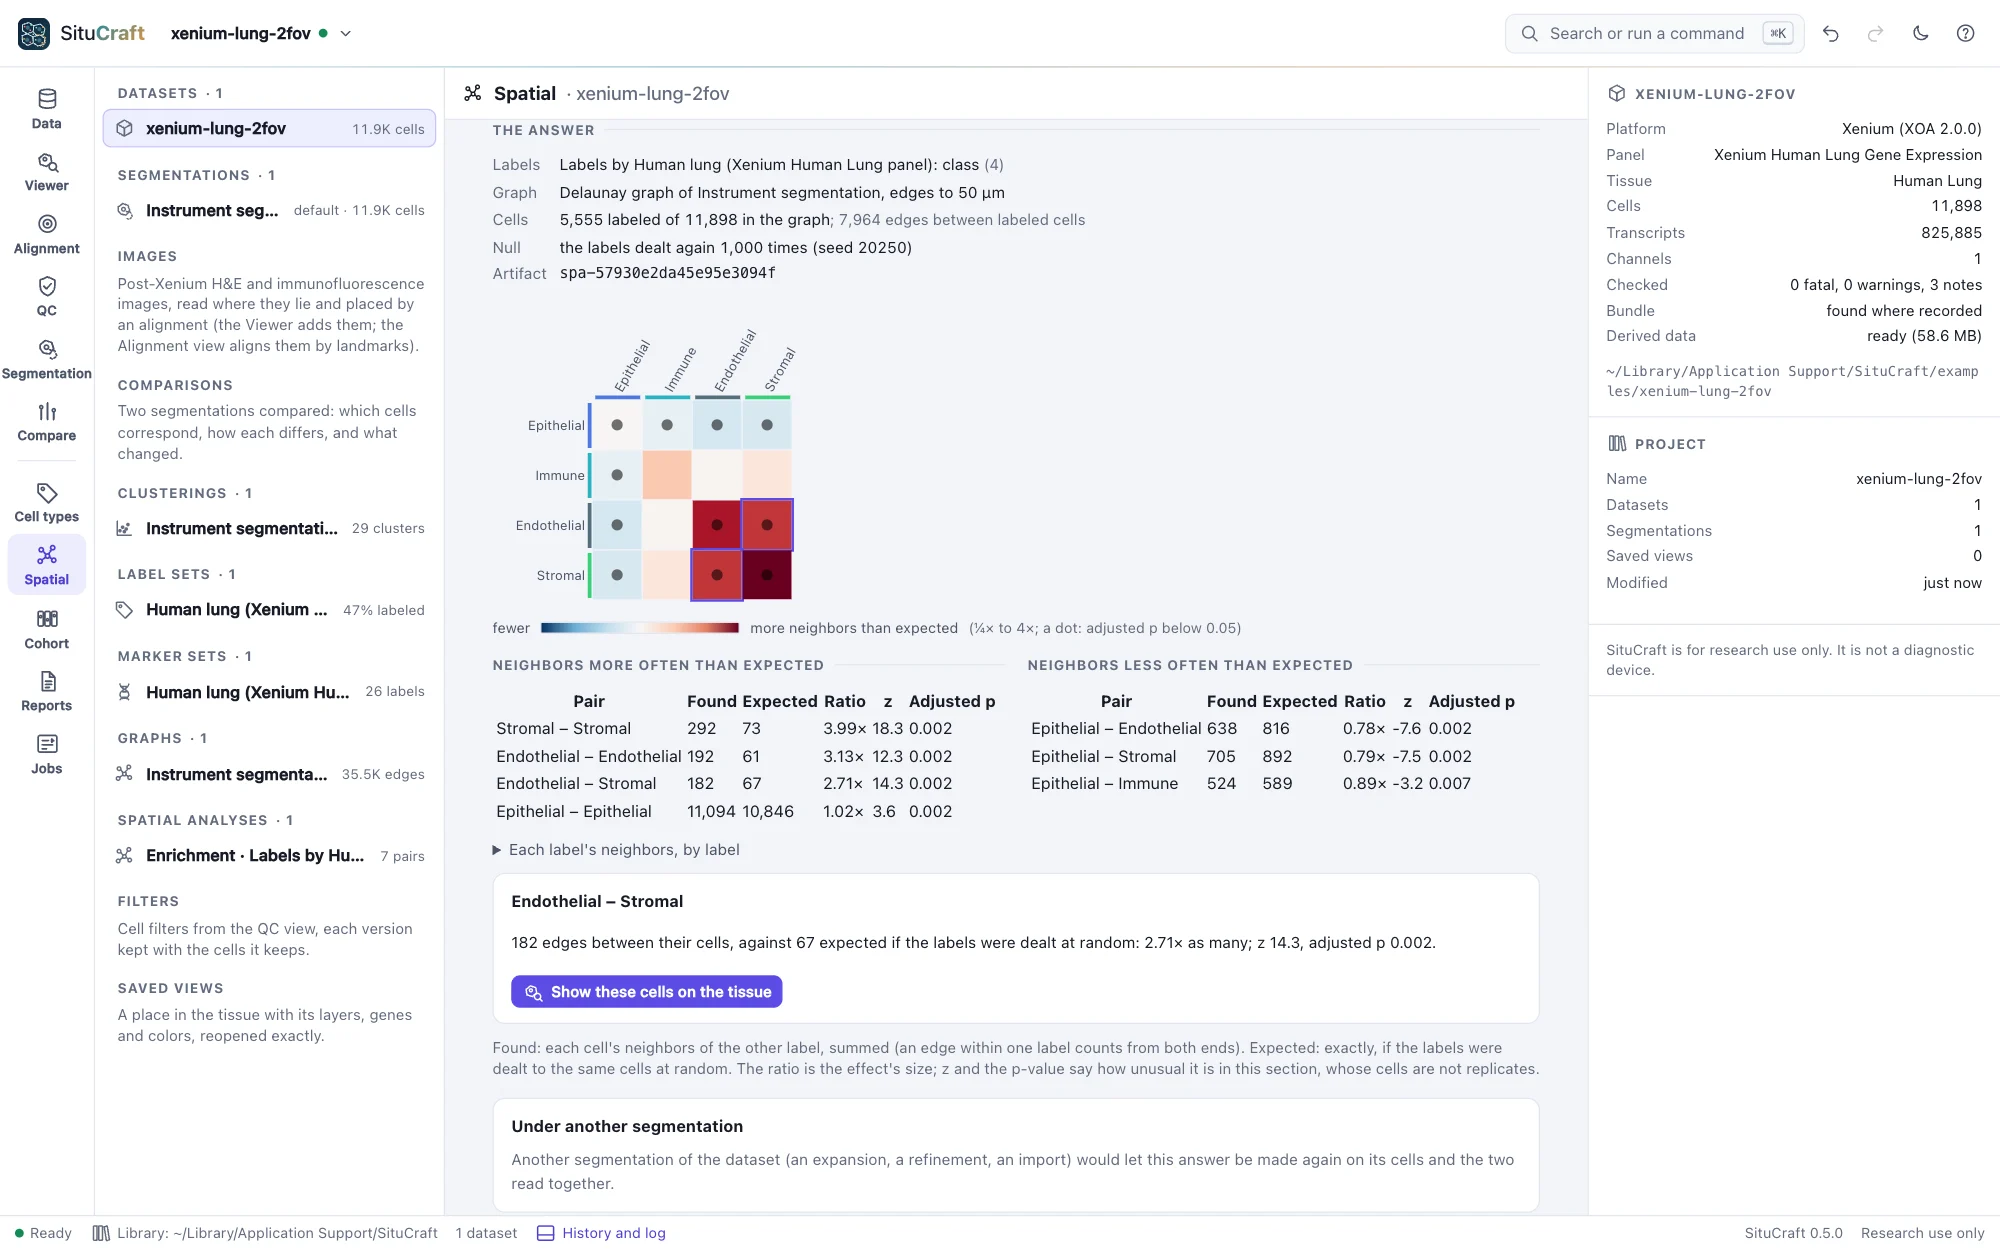
Graphs of which cells are neighbors; which cell types are neighbors more or less often than chance, and at what distances; what fills a region or gathers at its edge; the tissue's kinds of place (niches); the genes expressed in a pattern. Every number can show its cells on the tissue, and any answer can be made again on another segmentation to see how much it depends on the cells.

  • Enrichment, co-occurrence and Moran's I checked against Squidpy's
  • Ripley's K and L with the isotropic edge correction
  • A million cells' graphs, enrichment and niches in seconds on four cores
Spatial analysis
The Spatial view's answer on the Lung example: a heat map of the four classes' pairs, colored by the ratio of neighbors found to expected, and tables of the pairs most and least often neighbors with their counts, expectations, ratios, z-scores and adjusted p-valuesThe Spatial view's answer on the Lung example: a heat map of the four classes' pairs, colored by the ratio of neighbors found to expected, and tables of the pairs most and least often neighbors with their counts, expectations, ratios, z-scores and adjusted p-values
The Lung classes' neighborhood enrichment: neighbors found over expected, pair by pair.
Samples and cohorts

Groups compared with the subject as the unit

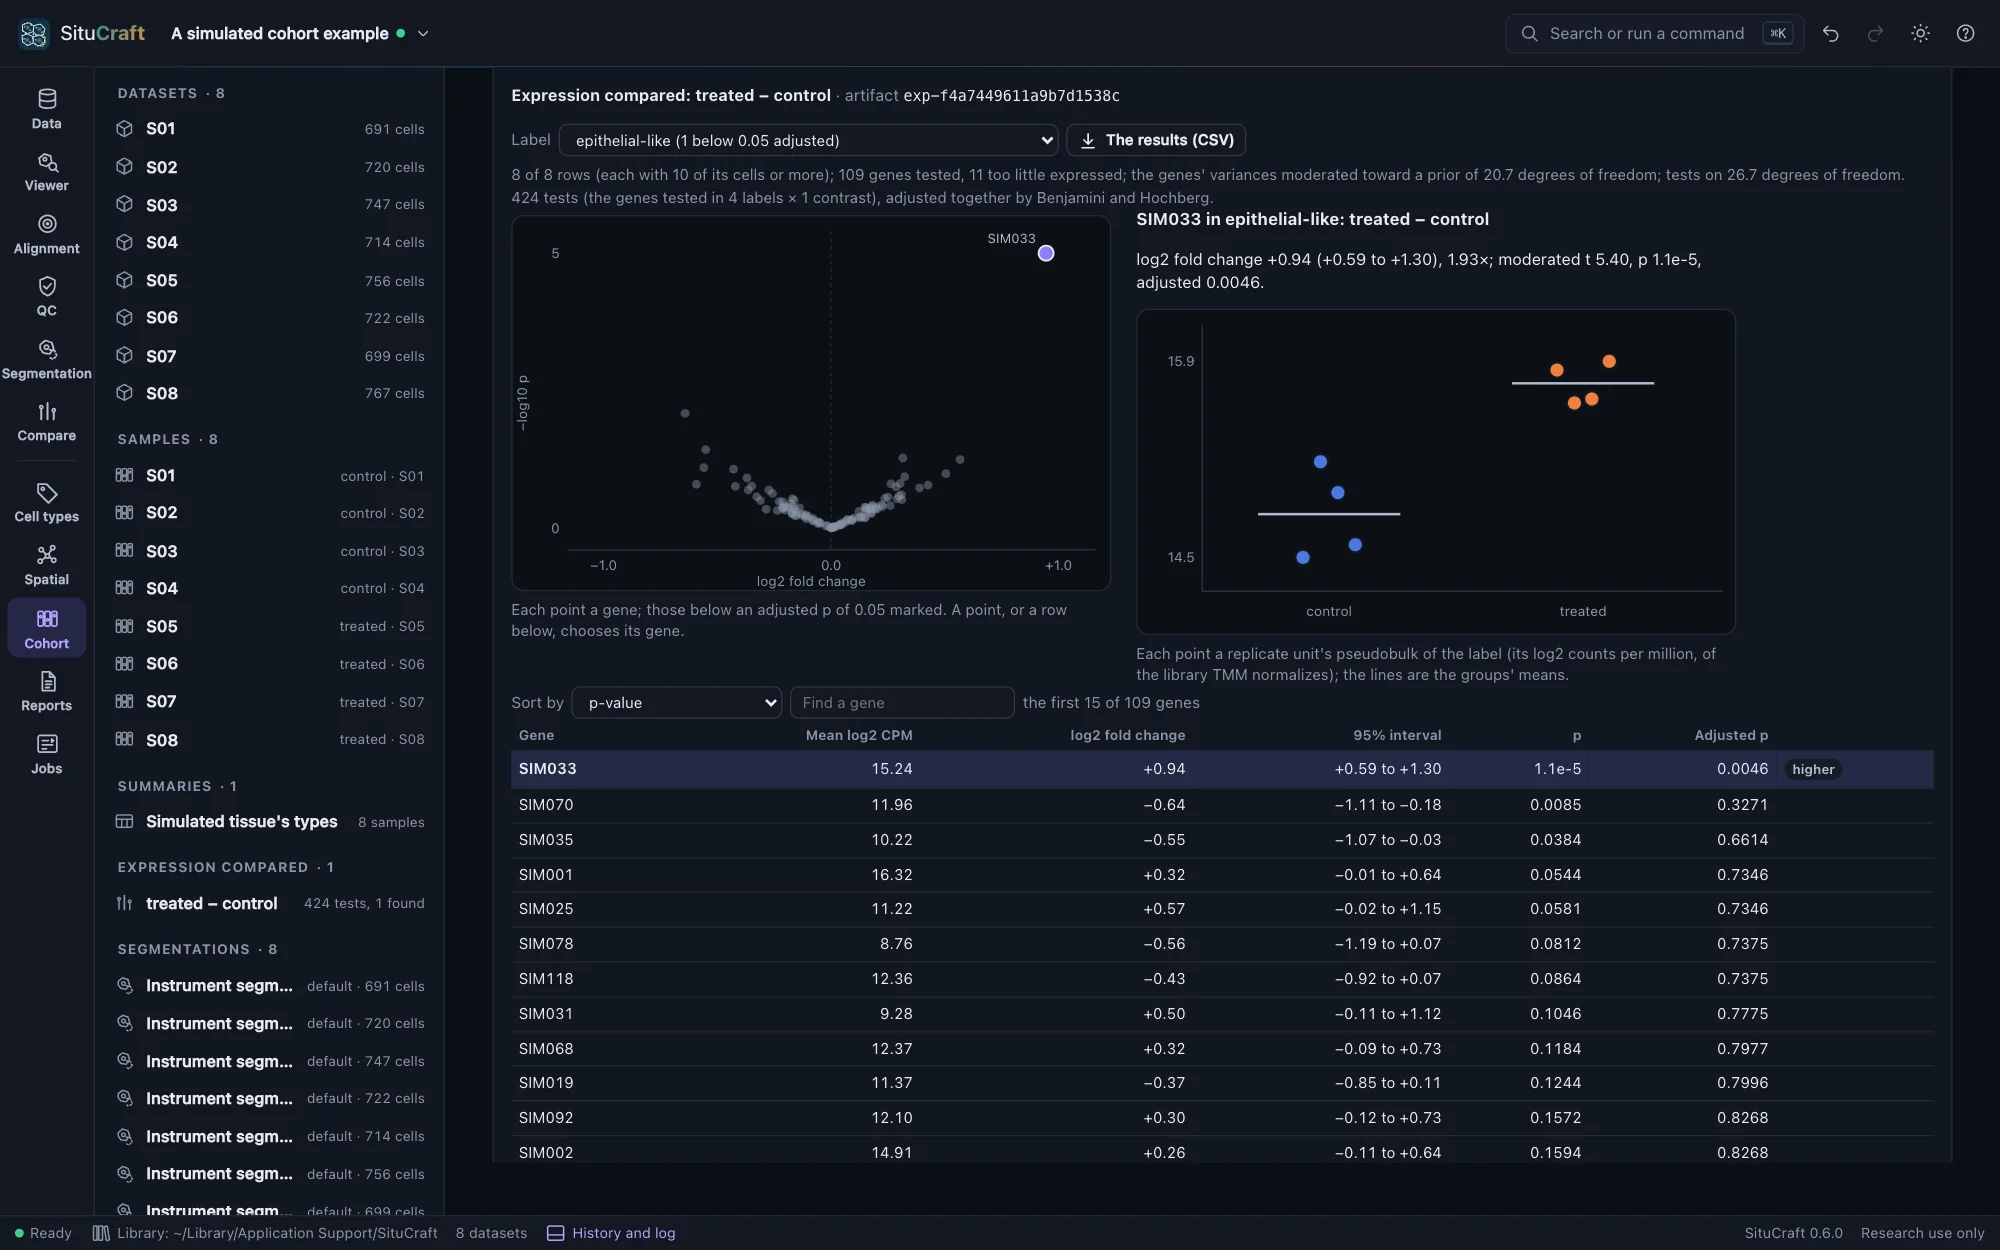
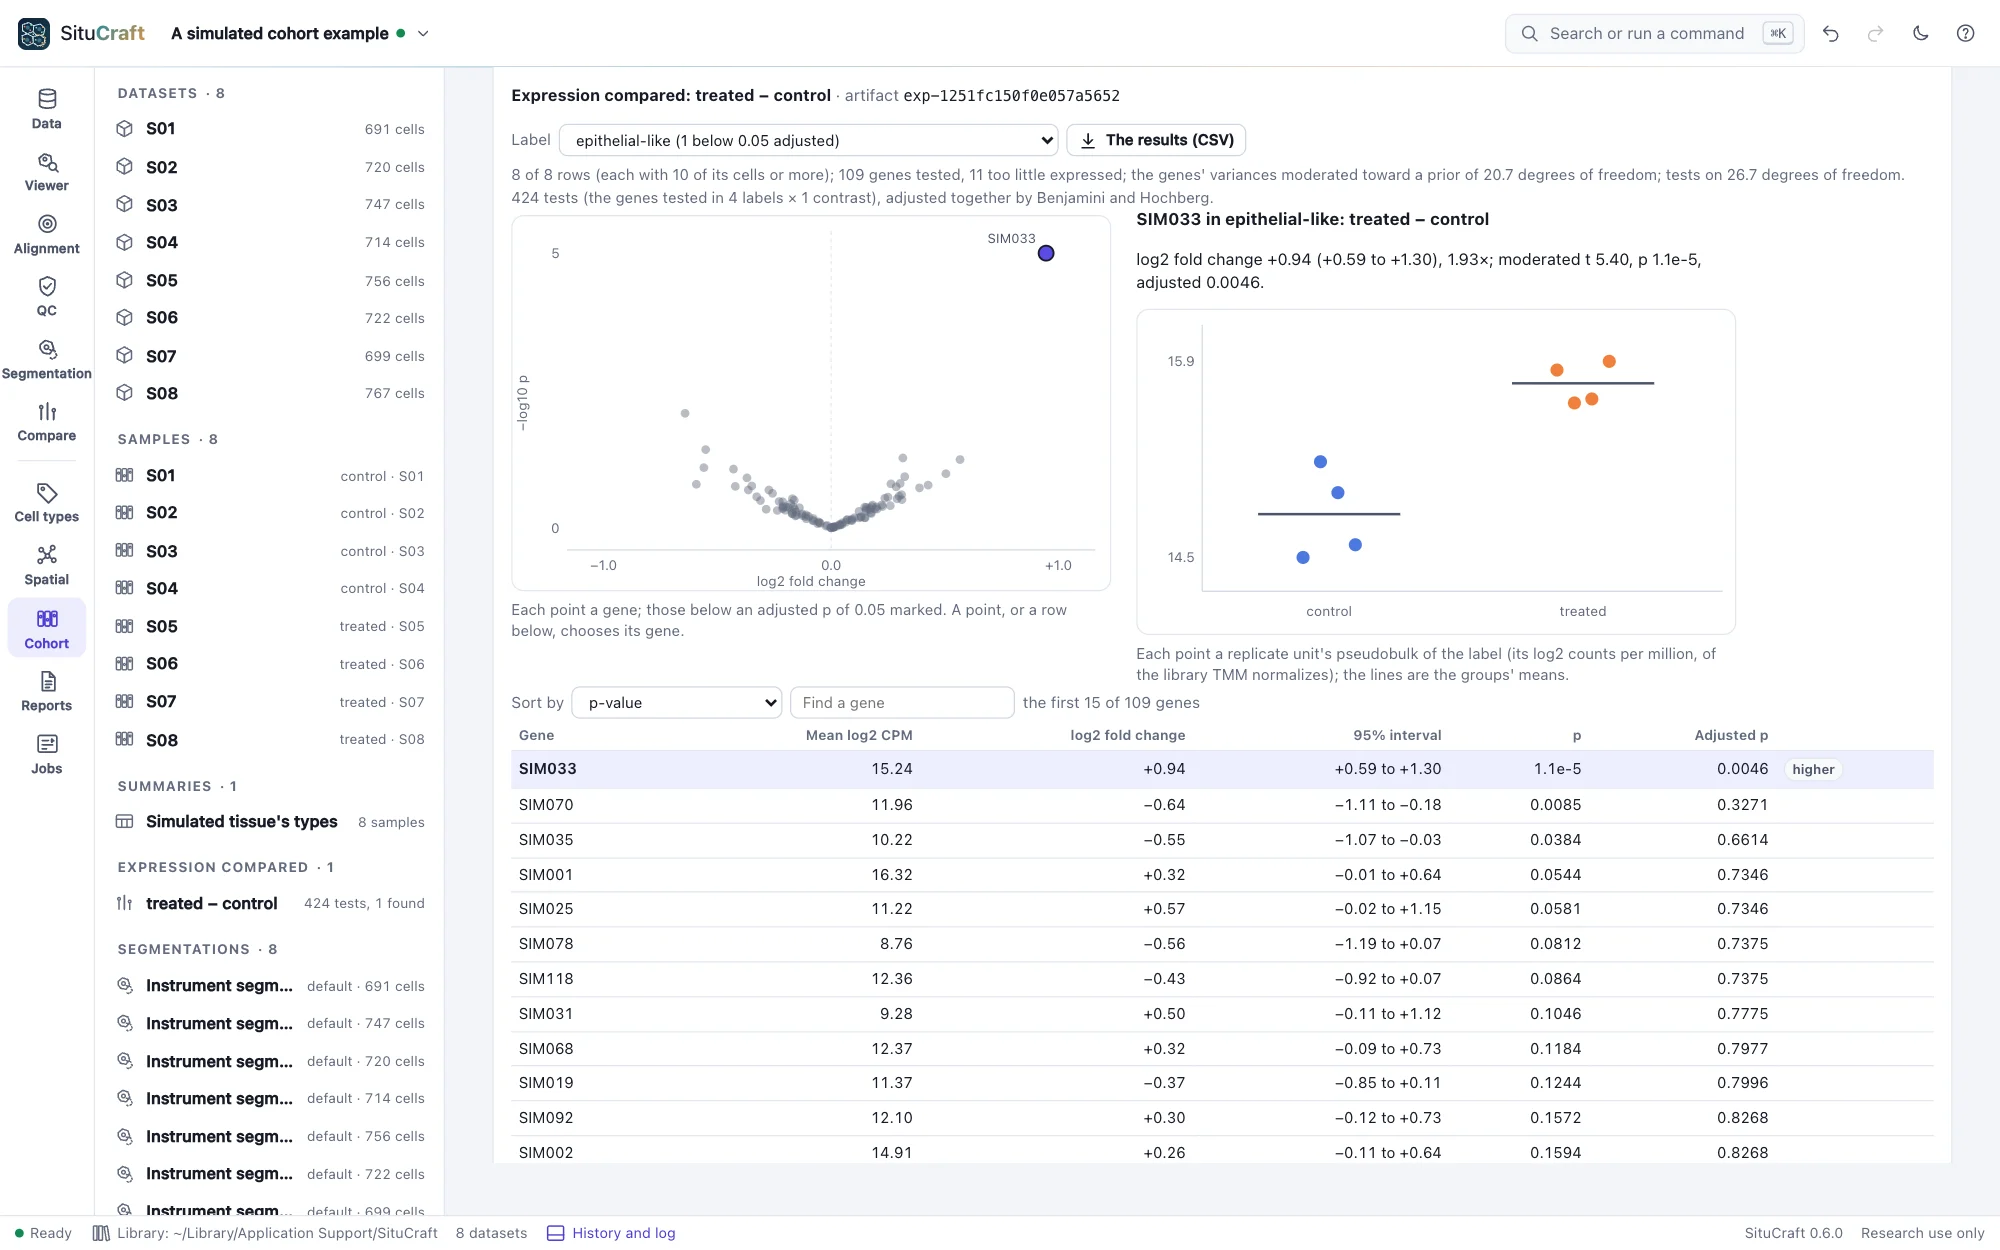
Bring a study's sections into one project, describe each sample, and state the design: the subject each came from, the groups, pairing and batches. The same steps run on every sample, and their cell types' abundances, genes and spatial statistics are compared between groups with each subject, not each cell, as one observation, every effect with its interval.

  • Expression's tests equal to limma's and edgeR's within 10⁻⁹
  • On 2,000 simulated null cohorts, each family's tests below 0.05 in 4.7% to 5.5% of them
  • Designs a batch could explain, or whose tests would be of cells, refused with why
The design
The Cohort view's differential expression of the simulated cohort's epithelial-like cells: the volcano with SIM033 far above the rest, SIM033's subjects by condition, and the genes ranked by p-value with SIM033 first and marked higherThe Cohort view's differential expression of the simulated cohort's epithelial-like cells: the volcano with SIM033 far above the rest, SIM033's subjects by condition, and the genes ranked by p-value with SIM033 first and marked higher
The simulated cohort's subjects compared by condition: SIM033, raised in the treated subjects' epithelial-like cells, the only gene found.
Figures and a provable record

Results others can check

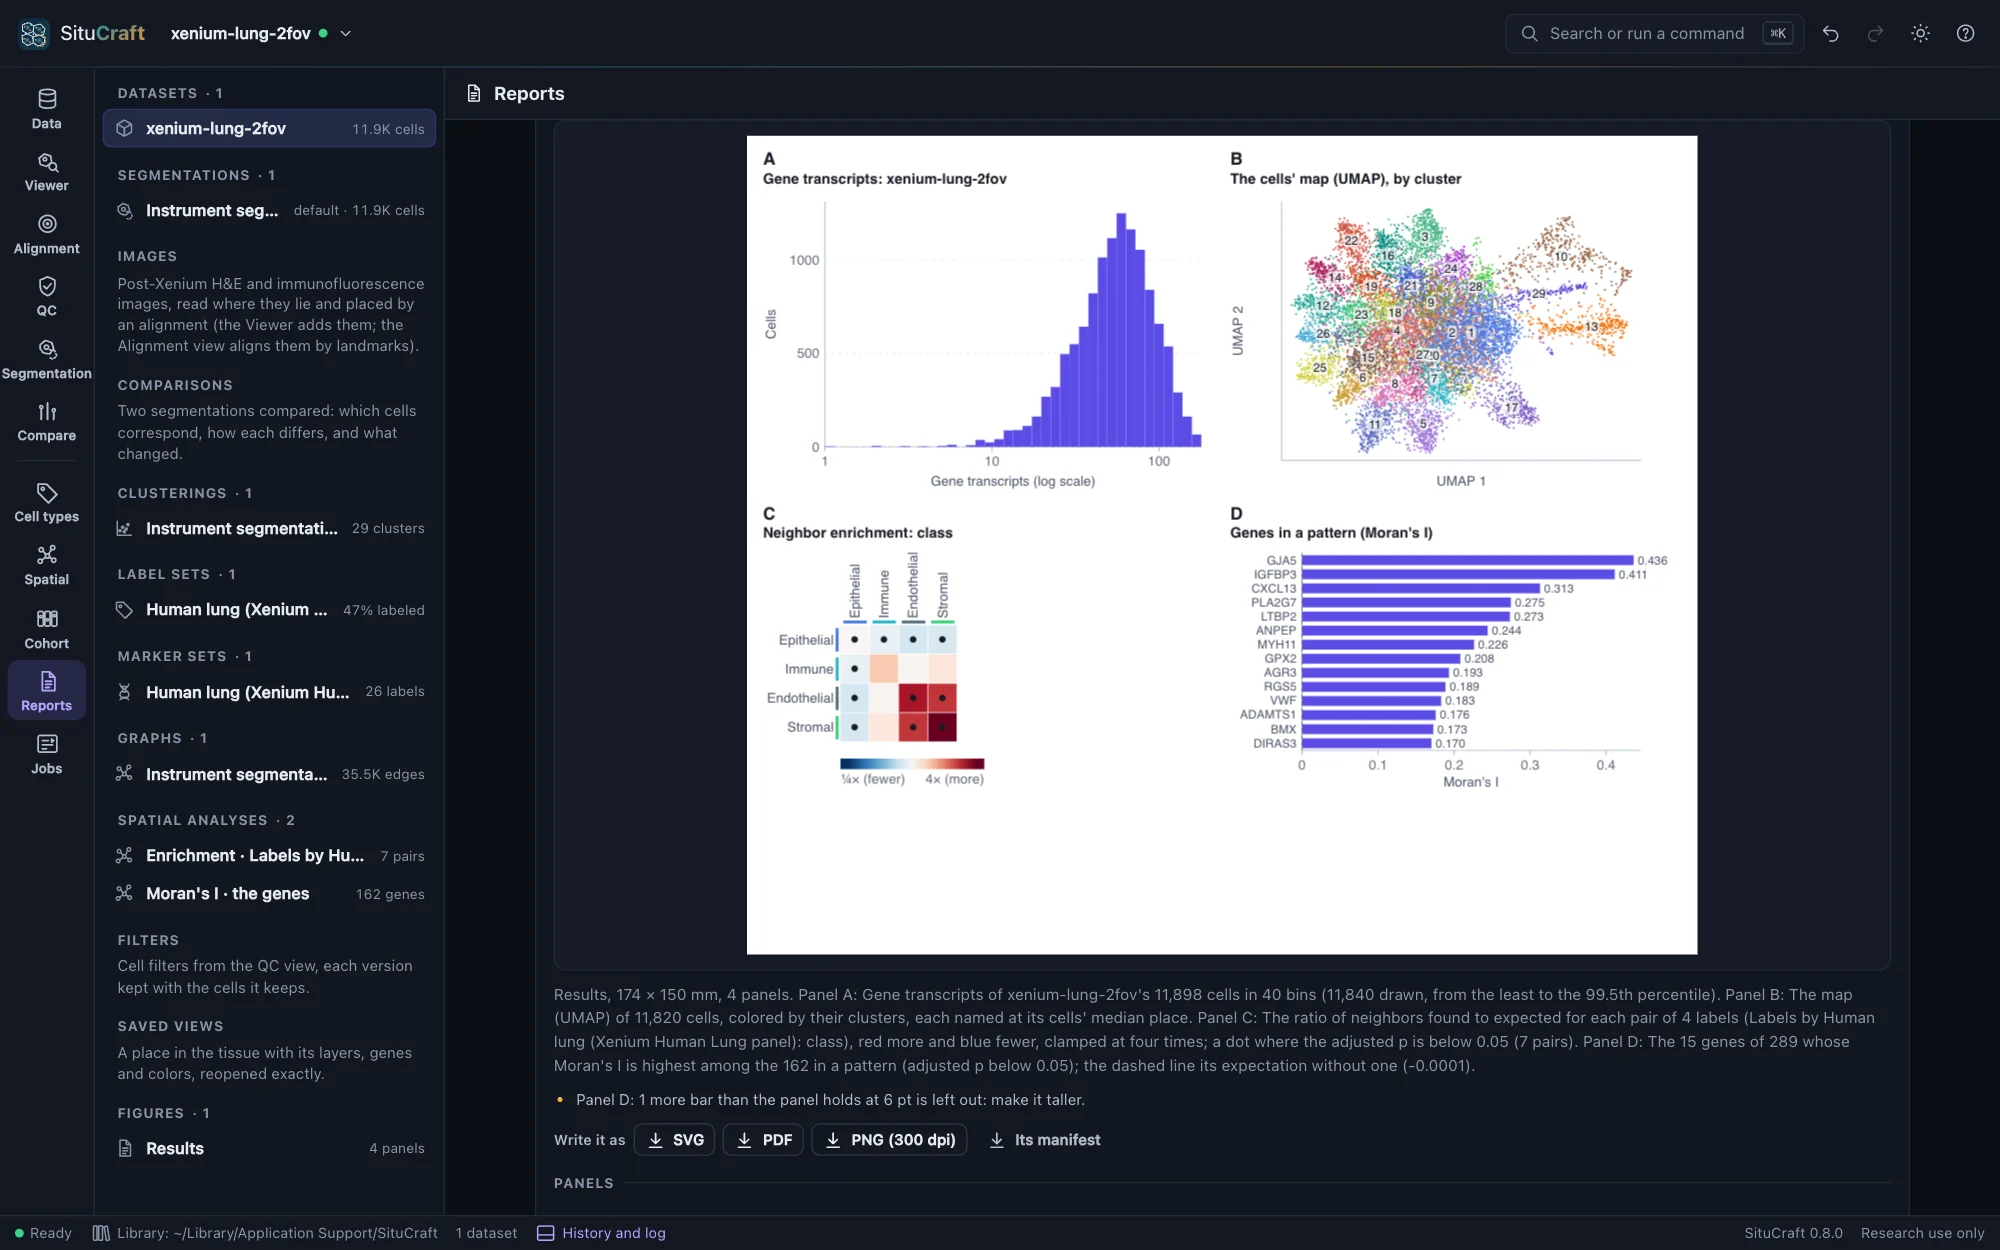
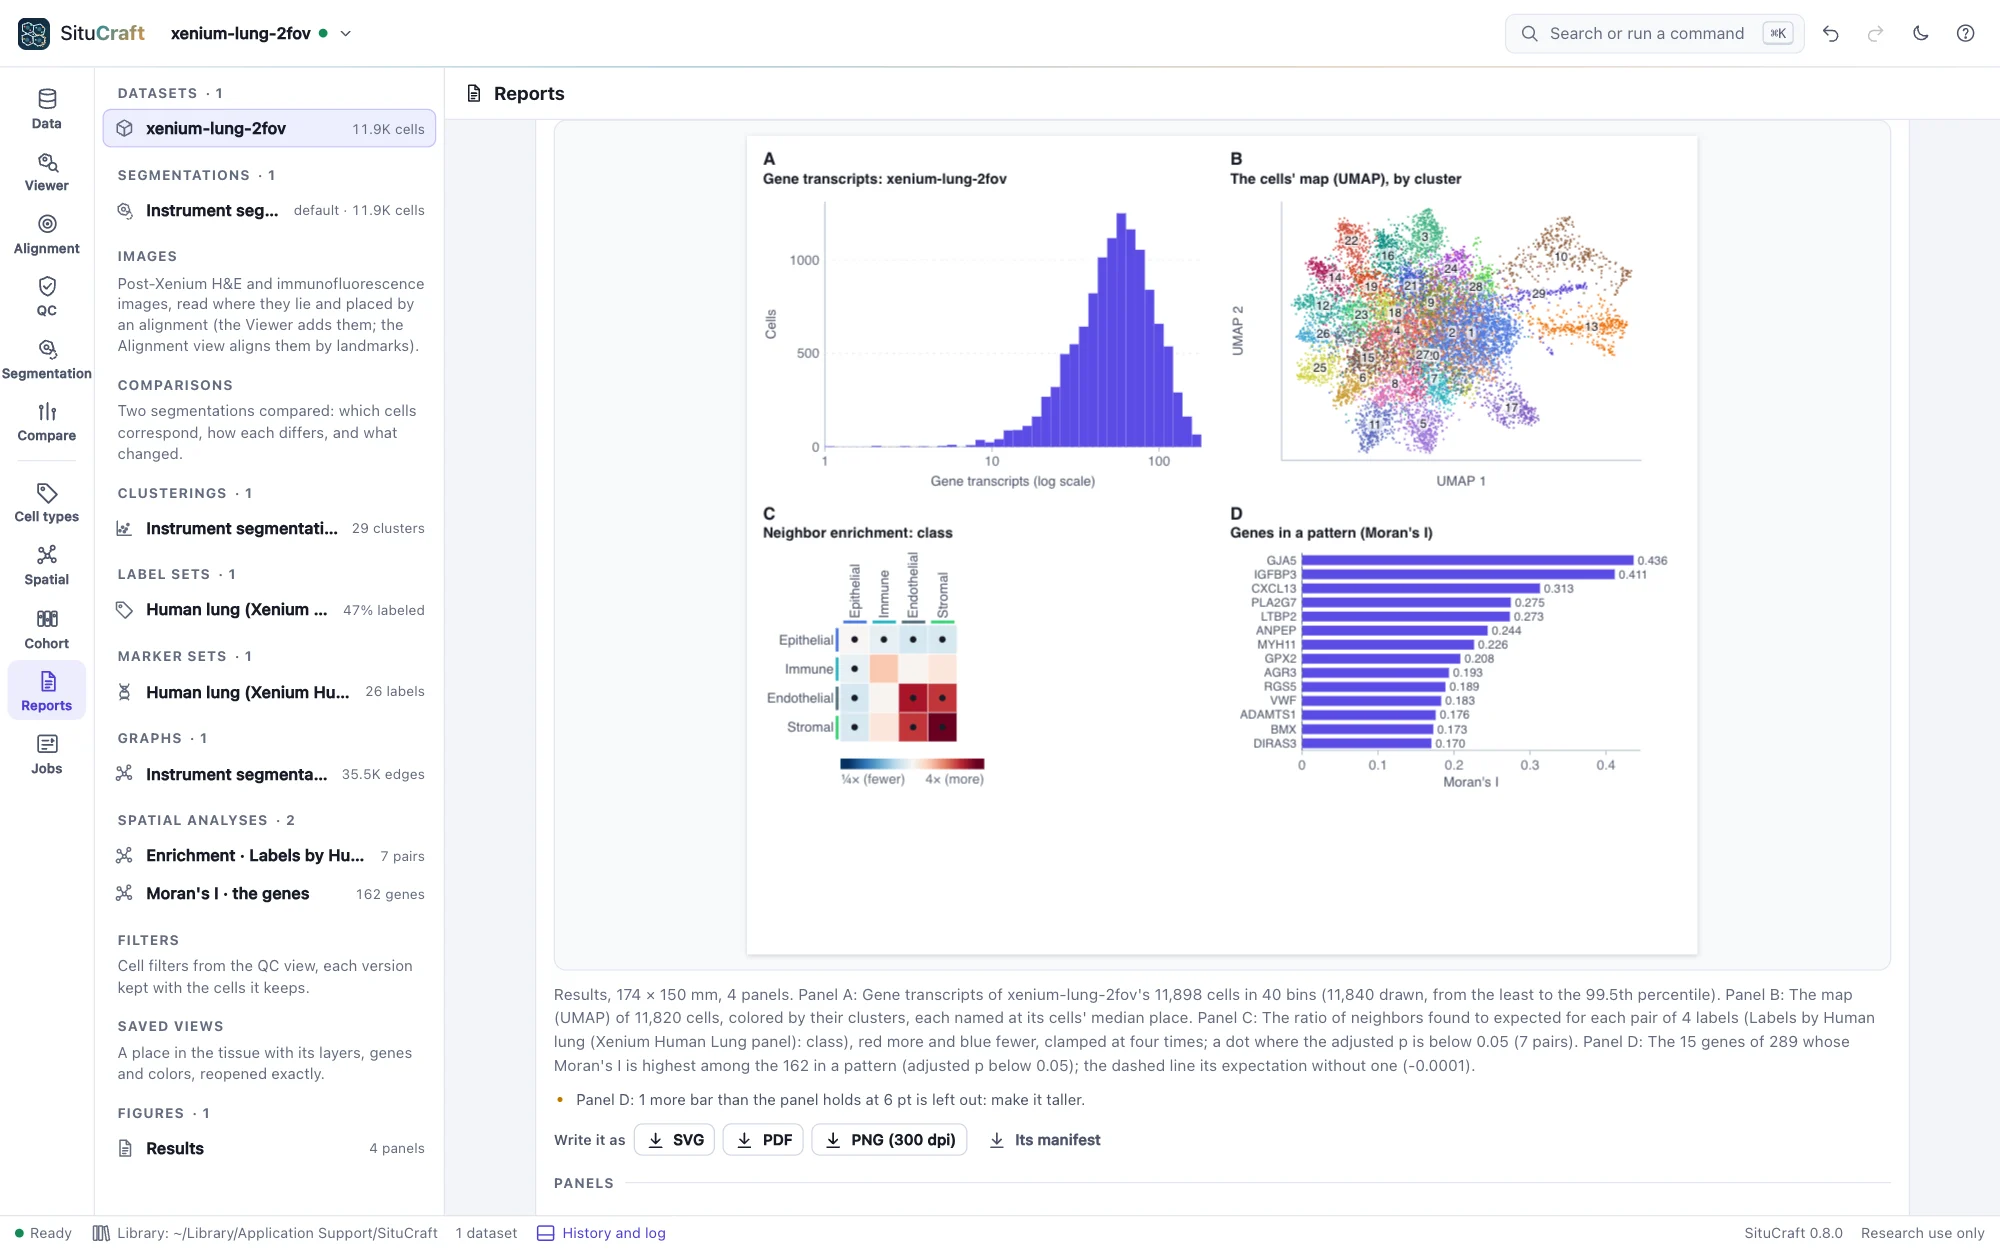
Figures are drawn from the project at a journal's column width, the tissue beside plots of results, each file carrying what it was drawn from. The methods are written from the record of every step. A certificate holds what a result rests on, and situcraft verify, or SituCraft itself, makes it again from the bundles and compares every file; a report or a package carries it to a reader, opens offline, and checks itself.

  • Figures read back by independent readers of SVG and PDF, the stains every pixel the suite's own composite
  • Certificates written on x86-64 made again on arm64, every file the same, bit for bit
  • Reports and packages opened offline: every number the certificate's, nothing left out found
The record and its certificate
The Reports view's preview of a figure of the Lung's results: its transcripts per cell, the cells' map by cluster, the classes' neighborhood enrichment and the genes in a pattern, lettered A to DThe Reports view's preview of a figure of the Lung's results: its transcripts per cell, the cells' map by cluster, the classes' neighborhood enrichment and the genes in a pattern, lettered A to D
A figure of the Lung's results, drawn from the project and previewed as it will print.
Agents and scripts

An agent works in your window

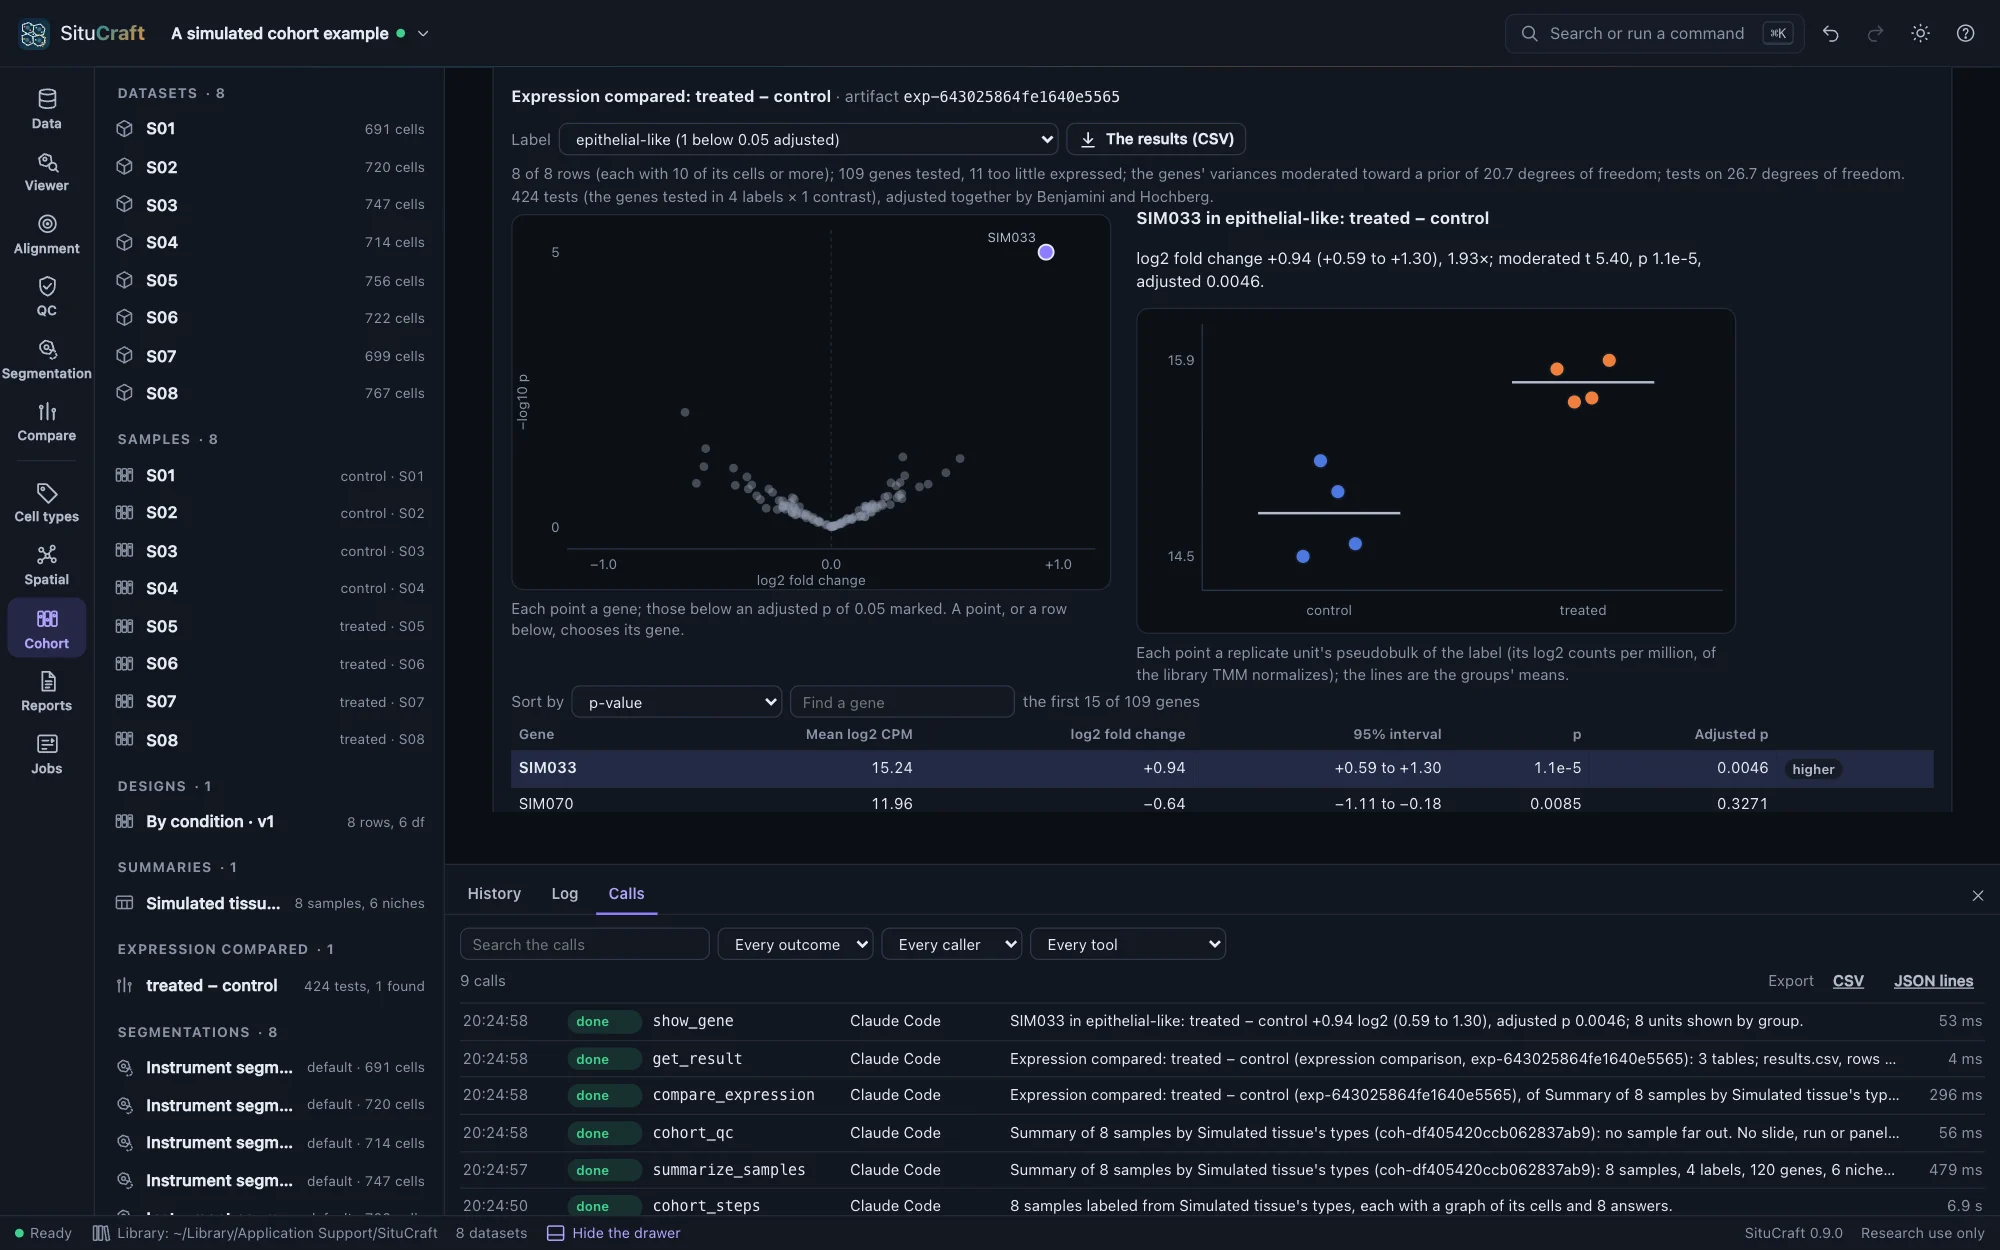
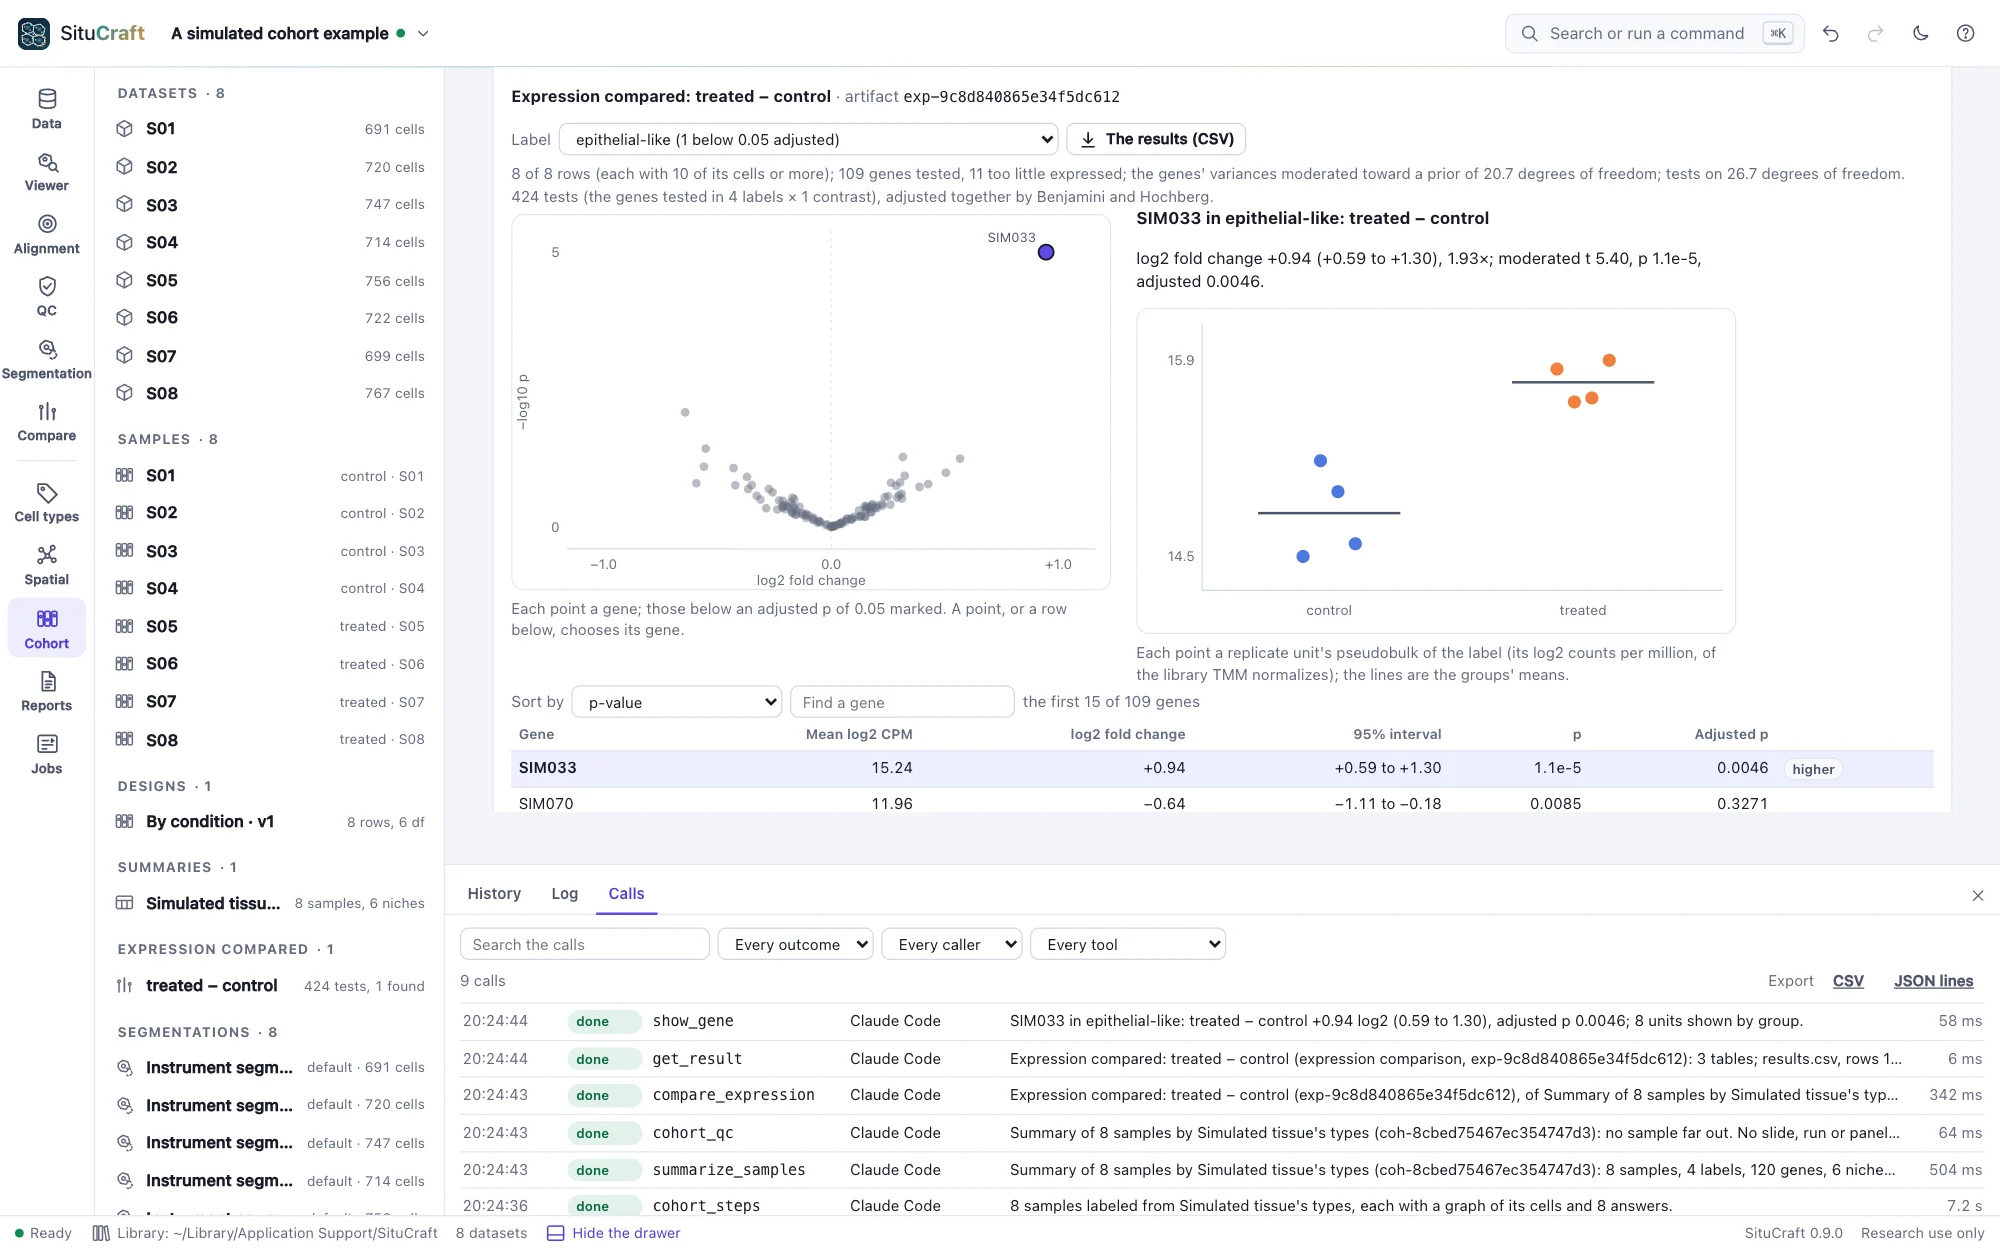
An AI agent such as Claude Code asks SituCraft about your projects through situcraft mcp, a Model Context Protocol server: it reads results and their records, asks which cells meet conditions as a typed tree, never a query string, shows you the tissue and, with the leave you give it, runs the analyses, each change in the history under its name and every call in your library's log. Python and R packages call the same actions, and situcraft run makes any result again from its recipe, on a server or a cluster's nodes.

  • Every tool driven through situcraft mcp in CI, those that only read leaving the project as it was
  • Recipes made again without a window, every result with the same id, and verified
  • An agent benchmark graded by code against known answers
Agents and scripts
SituCraft's Cohort view after an agent's session on the simulated cohort: the differential expression with SIM033 found, and the drawer's Calls tab listing the agent's callsSituCraft's Cohort view after an agent's session on the simulated cohort: the differential expression with SIM033 found, and the drawer's Calls tab listing the agent's calls
An agent's session on the simulated cohort, in your window: the comparison it made, and each of its calls in the drawer's log.
Validated

The same answers as the reference tools, and the truth

A validation suite checks each method against an independent implementation, published data, or a simulated tissue whose answers are known; the heaviest checks run every week.

AreaChecked againstAgreement
ReadersEvery Parquet column of both development bundles as DuckDB reads it, every Zarr array as zarr-python reads it, every TIFF's structure and pixels as tifffile reads themevery value
Bundle checksThe run's recorded values; thirteen bundles each broken one way22 values reproduced; exactly each one's findings
The ViewerEvery channel drawn at several levels, read back from the pagesample for sample
Nucleus expansionThe Lung bundle's own 5 µm expansionthe same 11,898 cells; 98.1% of pixels and 98.9% of transcripts in the same cells
RefinementA simulated tissue's true cells84.7% of transcripts in their true cell (the instrument's 82.2%)
Clusteringscanpy, leidenalg, umap-learn and scikit-learn on both bundles and the simulated tissuecomponents within 10⁻¹³; the same neighbors and leading markers; the true types found (adjusted Rand index 0.95)
Labels from markersscanpy's gene scoresevery cell's score within 3 × 10⁻⁷; 97% of simulated cells their true type
Labels from a referenceSingleR on both bundles and the simulated tissuecorrelations within 3 × 10⁻⁸; the same label on 99.97% to 100% of cells
Alignment10x's alignments of a published section's H&E and immunofluorescence; simulated images with known deformationwithin 0.61 and 0.68 µm of 10x's without them; within 0.2 µm of the truth
RegionsQuPath 0.7.0; annotations on a simulated H&Eopen there as written; within 0.18 µm of the truth
Cell graphsSciPy and Squidpyevery edge
Enrichment and co-occurrenceSquidpy 1.8.3 on the same graphsevery count; every z within its permutation error
Distances and Ripley's KSciPy's k-d tree; astropyevery median and mean; K without a correction to 10⁻⁹
Regions measuredShapelyevery area to 2 × 10⁻⁷; every count
Nichesscikit-learn's k-means; the simulated tissue's domainsinertia within 0.2%; the kinds of domain found (adjusted Rand index 0.92)
Moran's ISquidpy 1.8.3; an independent computation of both variancesevery gene's I to 10⁻¹⁵; variances to 10⁻¹²
Design matricespatsycolumn for column
Differential abundancestatsmodels 0.15.0 (and R) on 19 casesevery coefficient, interval and p to 10⁻⁸
Differential expressionlimma 3.68.5 and edgeR 4.10.5 on nine pseudobulk tablesthe same genes kept; every fold change, interval, t and p within 10⁻⁹
Spatial statistics comparedlimma 3.68.5 and statsmodels 0.15.0 on ten caseswithin 10⁻¹³
Error rates2,000 simulated null cohorts and 500 with known effectseach family within half a point of 5%; the effect gene found in 98%, its interval covering the truth in 95.0%
FiguresThe suite's own readers of SVG and PDF; its own composite of the stains' samplesevery mark as drawn; every pixel, and the Viewer's within one level
CertificatesResults made again by situcraft verify on x86-64 and arm64; copies tampered withevery file bit for bit; each edit found
ScaleA million generated cells, each analysis in a process of its own; a cohort of 2 million cellswithin budget: Moran's I in 88 s and 0.94 GB on four cores; the cohort in 4.2 minutes and 0.65 GB

Methods, validation and citation

Releases

One wave at a time

Each release adds one part of the work, validated before it ships. The changelog has the details.

ReleaseWhat it brought
0.1.0Open a Xenium bundle, check it, and see the tissue, its transcripts and its cells at any zoom, with QC linked to the tissue and a project that reopens exactly
0.2.0Segmentations as artifacts: nuclei expanded, others imported and exported, any two compared cell by cell in a workspace, and the decision recorded
0.3.0SituCraft's own transcript-informed segmentation, in a studio and the terminal, validated against simulated truth
0.4.0Cell identities: clusters, a map, labels from markers, a reference or elsewhere, reviewed with their evidence and read under two segmentations
0.5.0The pathology bridge: post-Xenium images aligned and checked in µm, regions exchanged with QuPath, and reviews with their provenance
0.6.0Niches and spatial statistics: graphs, enrichment, distances, regions measured, niches, spatially variable genes, and any answer made again on another segmentation
0.7.0Samples and cohorts: several sections in a project, their QC and design, and abundances, expression and spatial statistics compared between groups with the subject as the unit, their error rates measured
0.8.0Figures and a provable record: figures with scale bars, legends and provenance, the methods text, certificates made again by situcraft verify, and reports and packages that check themselves
0.9.0Agents and scripts: an MCP server whose agents work in your window with the leave you give them, cells asked for by a typed tree, every call logged, recipes made again without a window on a cluster, R and Python clients, and an agent benchmark
0.10.0 (coming)Whole slides and other platforms: whole-slide performance, CosMx and MERSCOPE readers, and the newer Xenium software

Get started in a minute

Install with one command, then run situcraft. It opens its own window, with two public Xenium sections, a simulated tissue and simulated cohorts ready to explore.

$ curl --proto '=https' --tlsv1.2 -fsSL https://raw.githubusercontent.com/robert-mcdermott/situcraft/main/install.sh | sh
$ situcraft