v0.9.0 Single cells: expression maps, clonotypes, phenotypes and AnnData export

Immune repertoires you can check

ClonoLoom is a desktop workbench for researchers studying T- and B-cell receptor repertoires. Compare samples and study groups, measure diversity, track clones over time, explore B-cell families and mutations, and connect receptors with single-cell expression and cell states. Use it to investigate immune responses across individuals, experimental conditions and time—including vaccination, disease and treatment studies.

Turn your analyses into clear figures, shareable results and cited methods, with a record of the data and choices behind each result. ClonoLoom runs locally on macOS, Linux and Windows, with no account, Python or R required. Public-data queries and sequence transfers require your explicit approval.

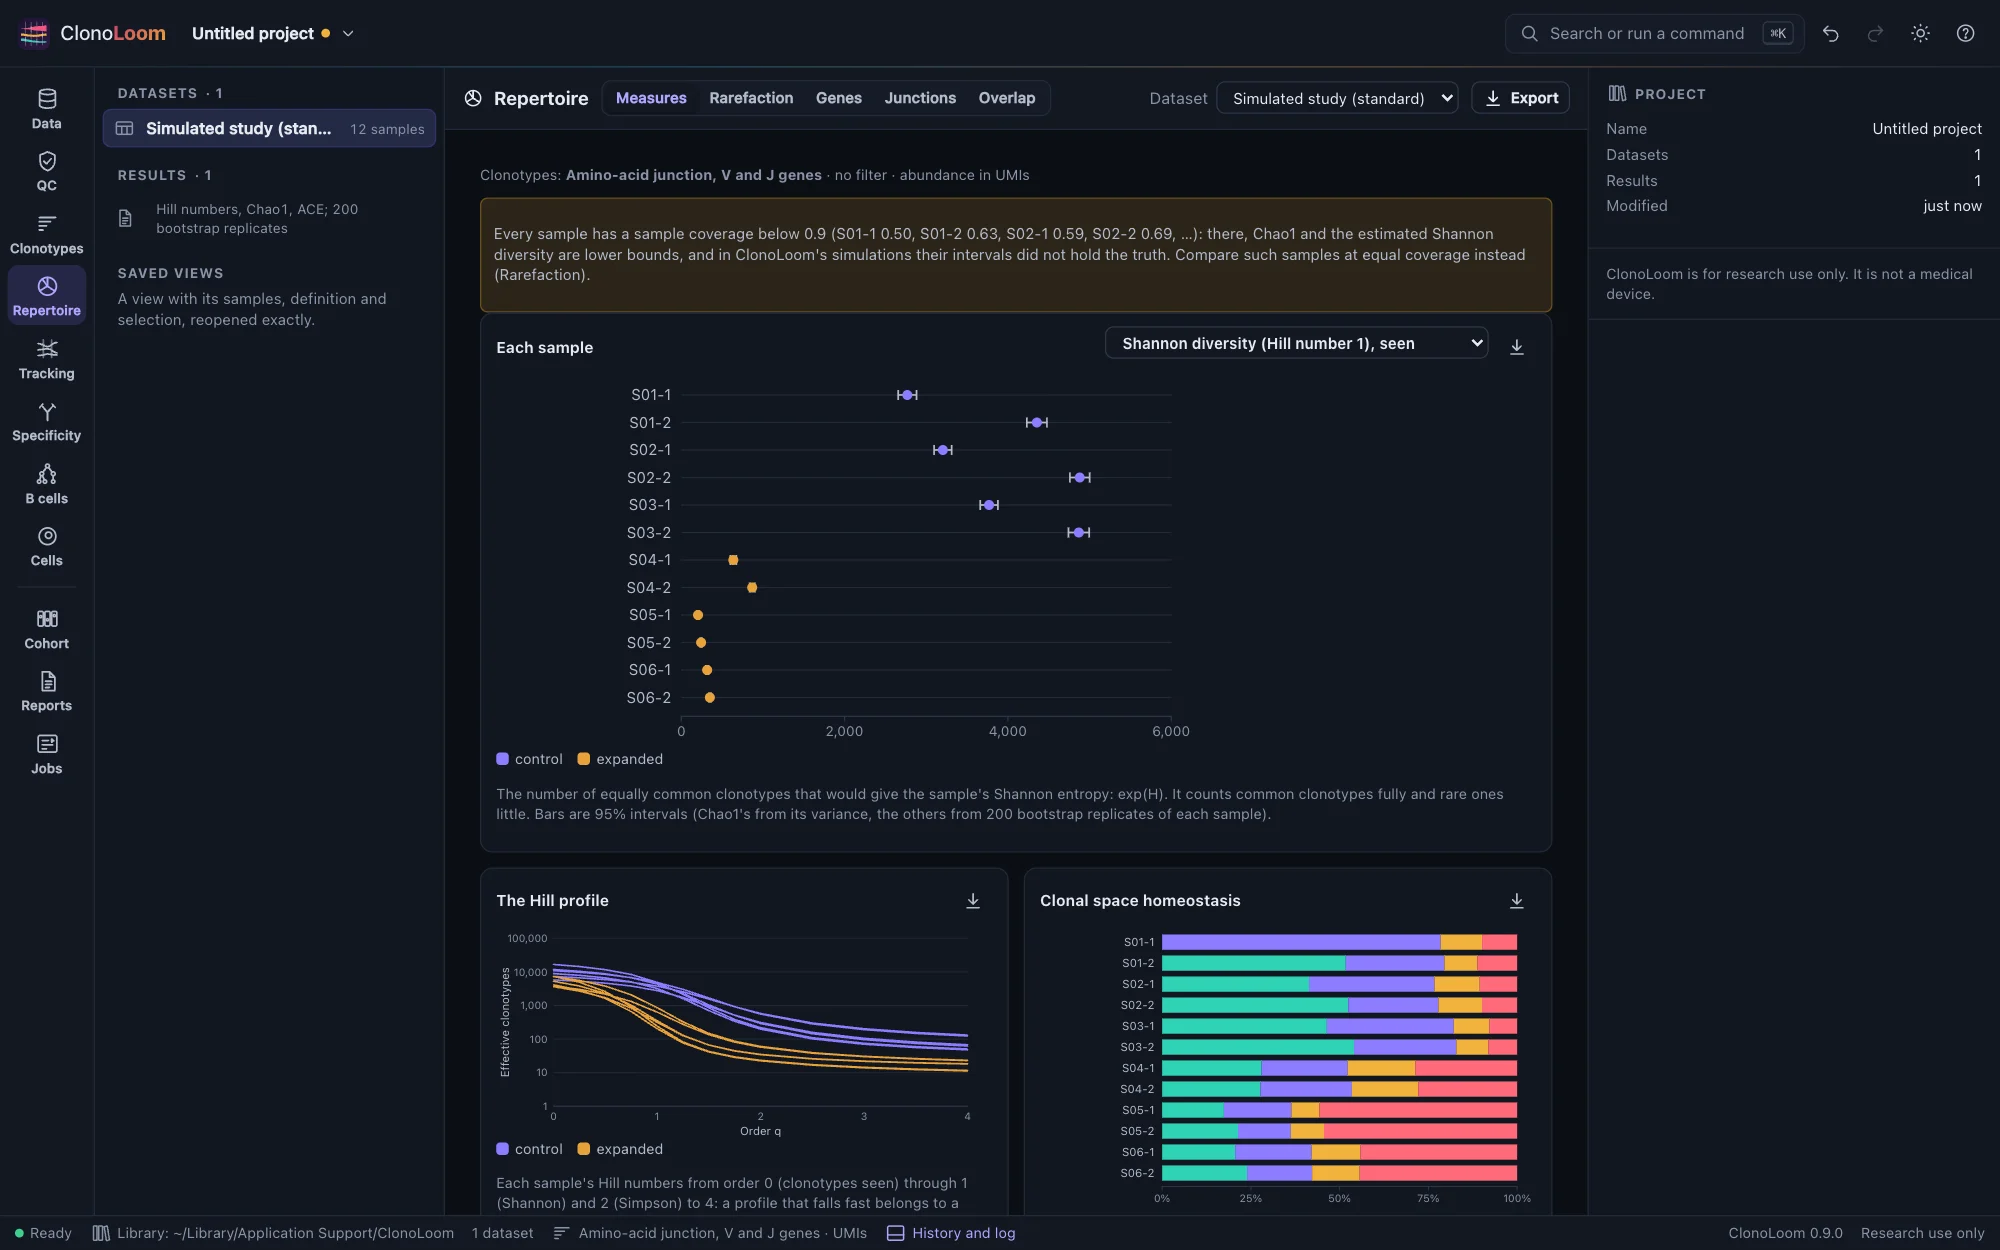
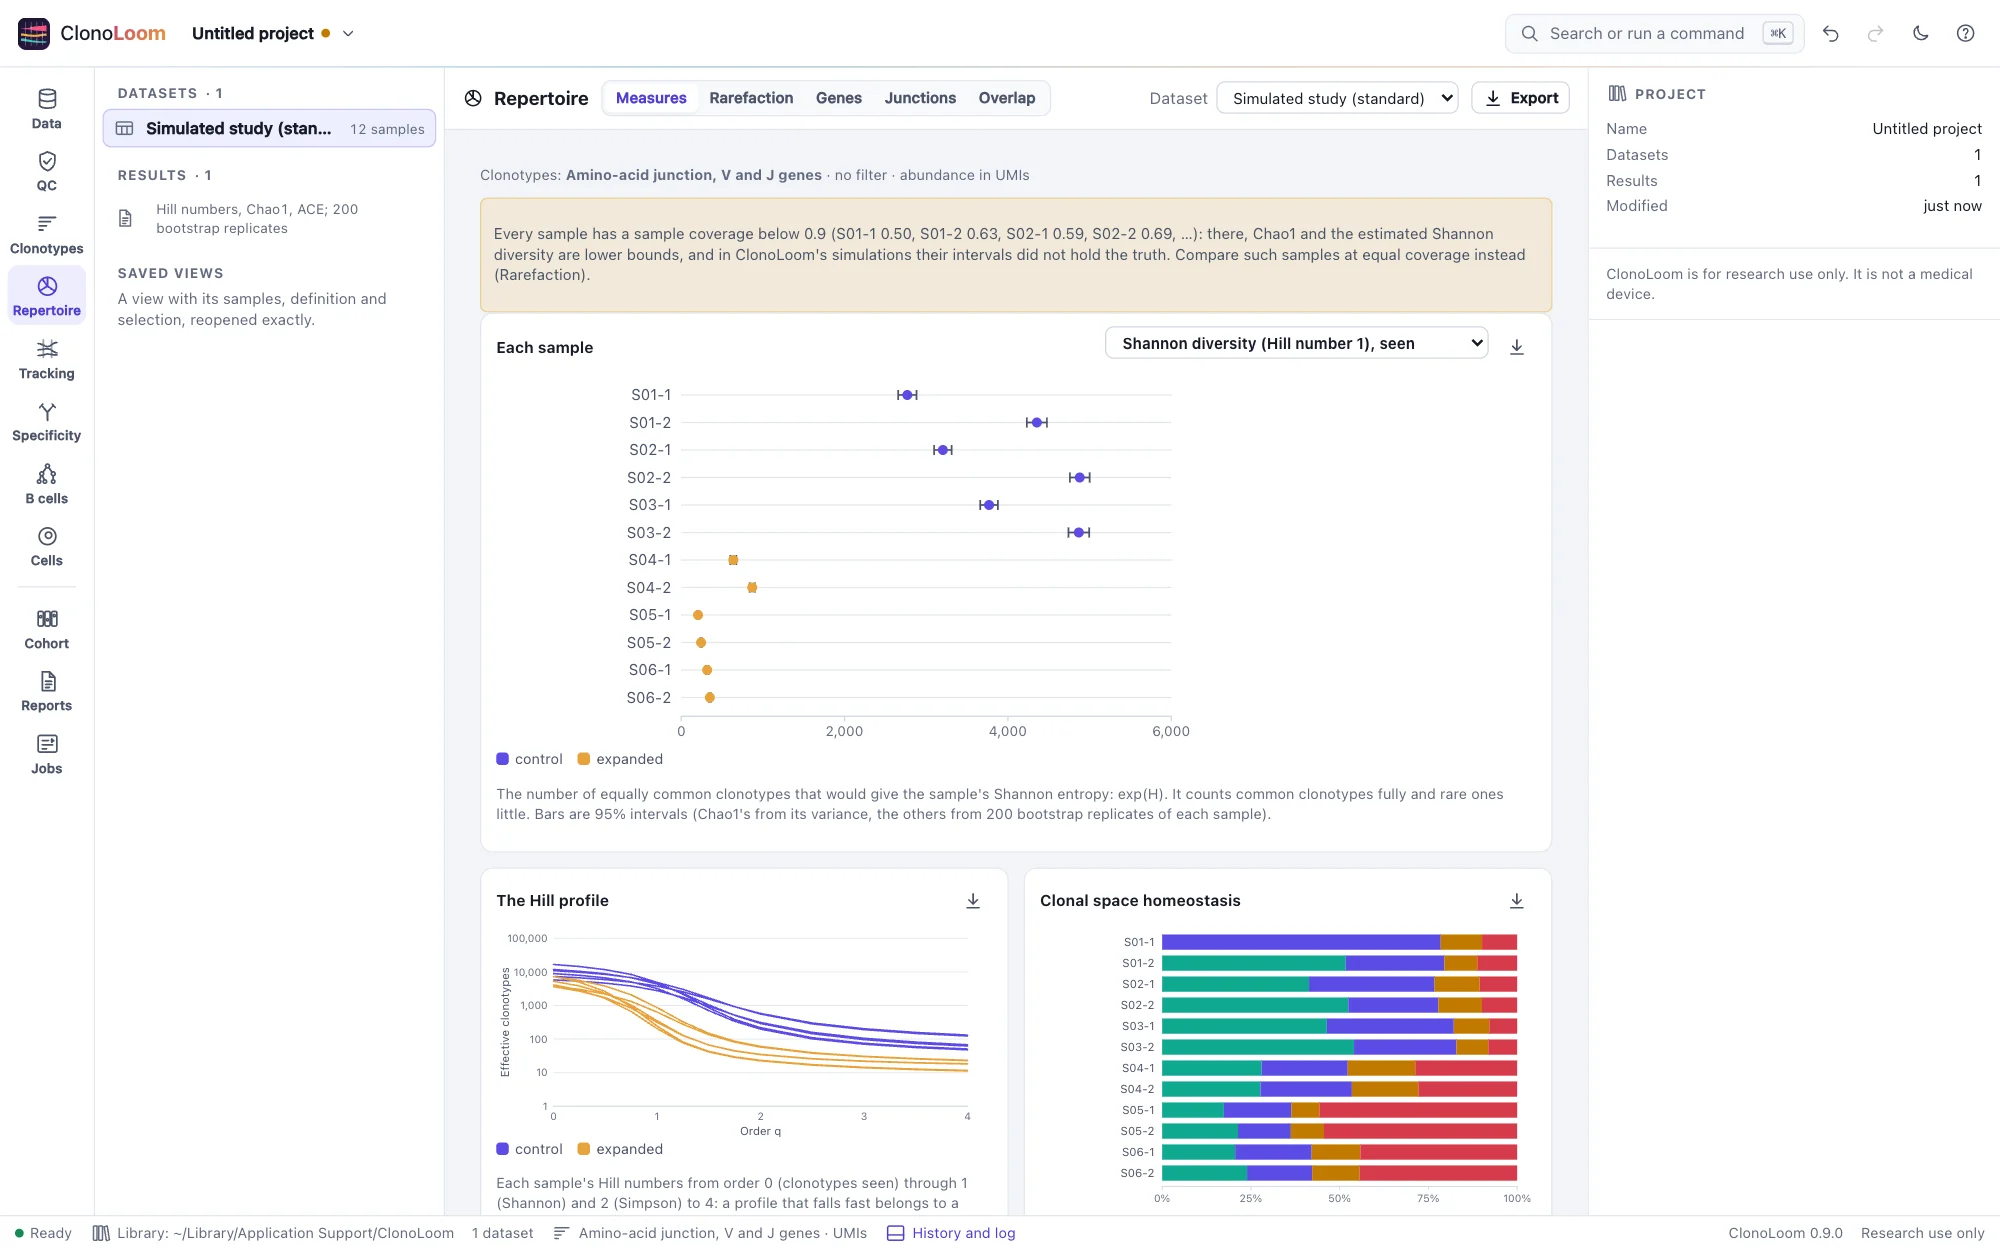
ClonoLoom's Repertoire view: the Shannon diversity of a simulated study's twelve samples, each with its 95% interval and colored by condition, the Hill profile and clonal space homeostasisClonoLoom's Repertoire view: the Shannon diversity of a simulated study's twelve samples, each with its 95% interval and colored by condition, the Hill profile and clonal space homeostasis
A simulated TRB study of twelve samples, one of the examples: each sample's Shannon diversity with its 95% interval, the Hill profile and clonal space homeostasis.
$ curl --proto '=https' --tlsv1.2 -fsSL https://raw.githubusercontent.com/robert-mcdermott/clonoloom/main/install.sh | sh

Installs the latest release in ~/.local/bin after checking its SHA-256 checksum, then prints how to start it. Other options

Free and open source (Apache 2.0) · macOS, Linux and Windows · x64 and ARM64 · for research use

Checked from the file up

Every file read by ClonoLoom's own readers and checked against independent ones; a validator that says what is wrong, in how many rows, and what to do; Cell Ranger's and immunoSEQ's own numbers recomputed from the rows.

Clonotypes by definition

A clonotype is whatever its definition says. The junction, the genes, the chains and the rules for single cells are a named choice, stated in words with every table, figure, export and methods paragraph.

Every number with its uncertainty

Diversity, gene usage and overlap each with a 95% interval, how often those intervals hold the truth measured on simulated repertoires; samples compared at equal coverage rather than as deep as they happened to be sequenced.

Private and on the record

One program for macOS, Linux and Windows. Analysis runs on your computer and leaves source files unchanged. Public queries and sequence handoffs require explicit review. Every result is kept with what it was made from, and a methods paragraph is written from that record.

What it does

From the annotation pipeline to results others can check

Open a study's receptor data, check them, look at each sample's quality, define clonotypes, measure the repertoires and compare them, and write it up so that others can check it, each step kept on record.

B cells

From sequence evidence to families and lineages

Inspect AIRR or joined IMGT annotations, choose a family threshold within subjects, reconstruct D-masked germlines from pinned references, and measure substitutions with explicit denominators. Explore parsimony trees with their ties and ancestral ambiguity; summarize observed constant calls with cell counts and unresolved calls retained.

  • Source rows, parent checksums and cited methods stay with each result
  • Full CSV/JSON tables, germline and lineage FASTA, and Newick tree exports
  • Artificial known truth checks bookkeeping; trees and co-occurrence do not establish switching events
Try the artificial immunization workflow
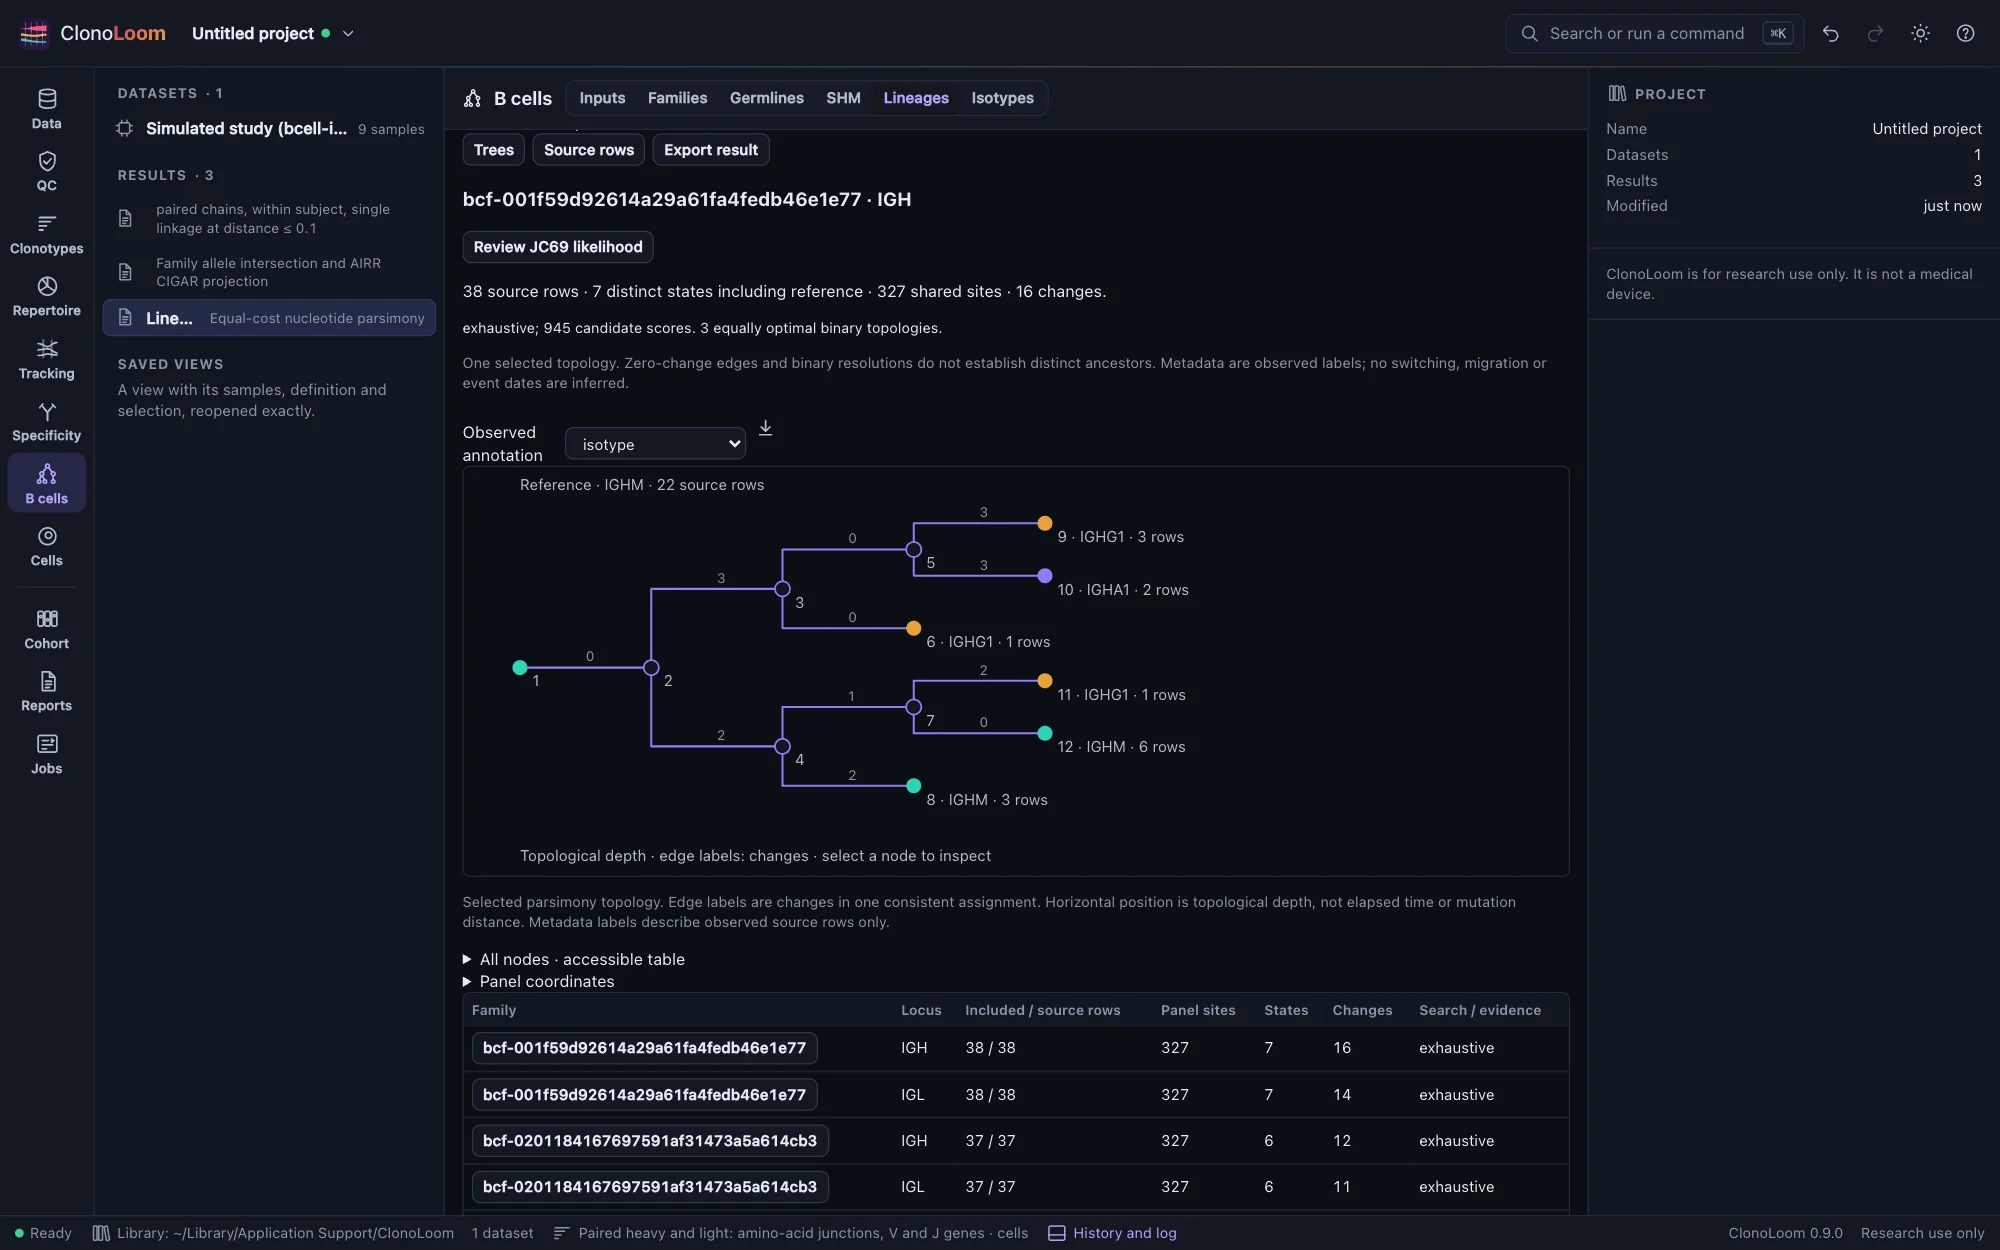
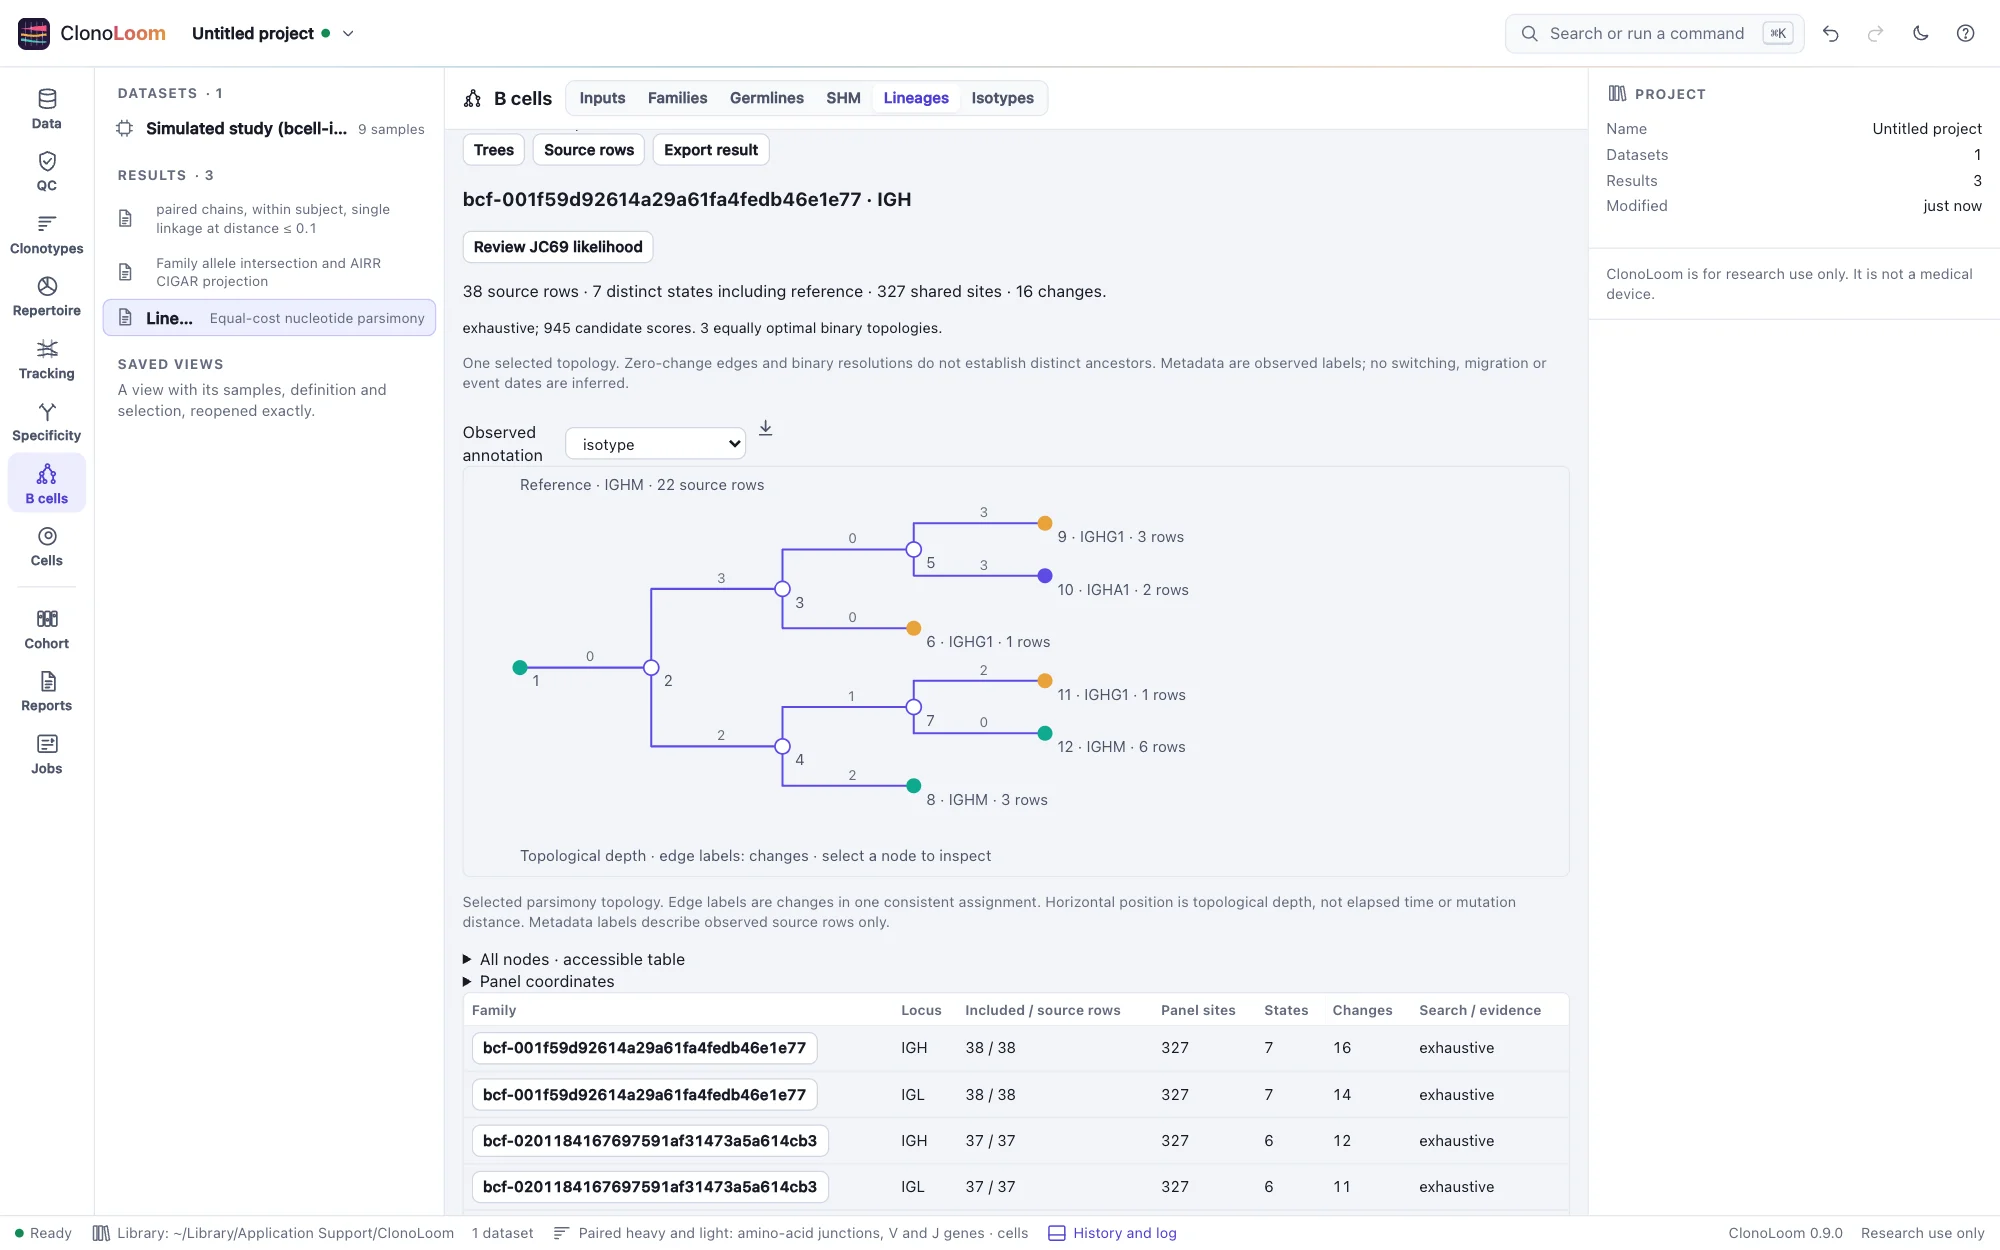
An artificial B-cell lineage tree with observed labels, branch changes and topology uncertaintyAn artificial B-cell lineage tree with observed labels, branch changes and topology uncertainty
One of the artificial study's 72 family/locus trees. Alternative optimal topologies remain explicit.
Open and check

Data checked before they are used

ClonoLoom reads AIRR Rearrangement tables with their Repertoire metadata, Cell Ranger V(D)J outputs, immunoSEQ exports, MiXCR clone tables, OAS and OTS data units and tcrdist3 clone tables with its own readers, fingerprints every file by its SHA-256, and checks it: each finding fatal, a warning or a note, with how many rows it concerns, examples, and what to do. The abundance unit is stated, never guessed.

  • Every column of 25 development files as the airr library and pandas read it
  • Another tool's CSV or TSV through a mapping of its columns, checked column by column
  • A moved file found again by its fingerprint; a changed one never read in its place
Opening data
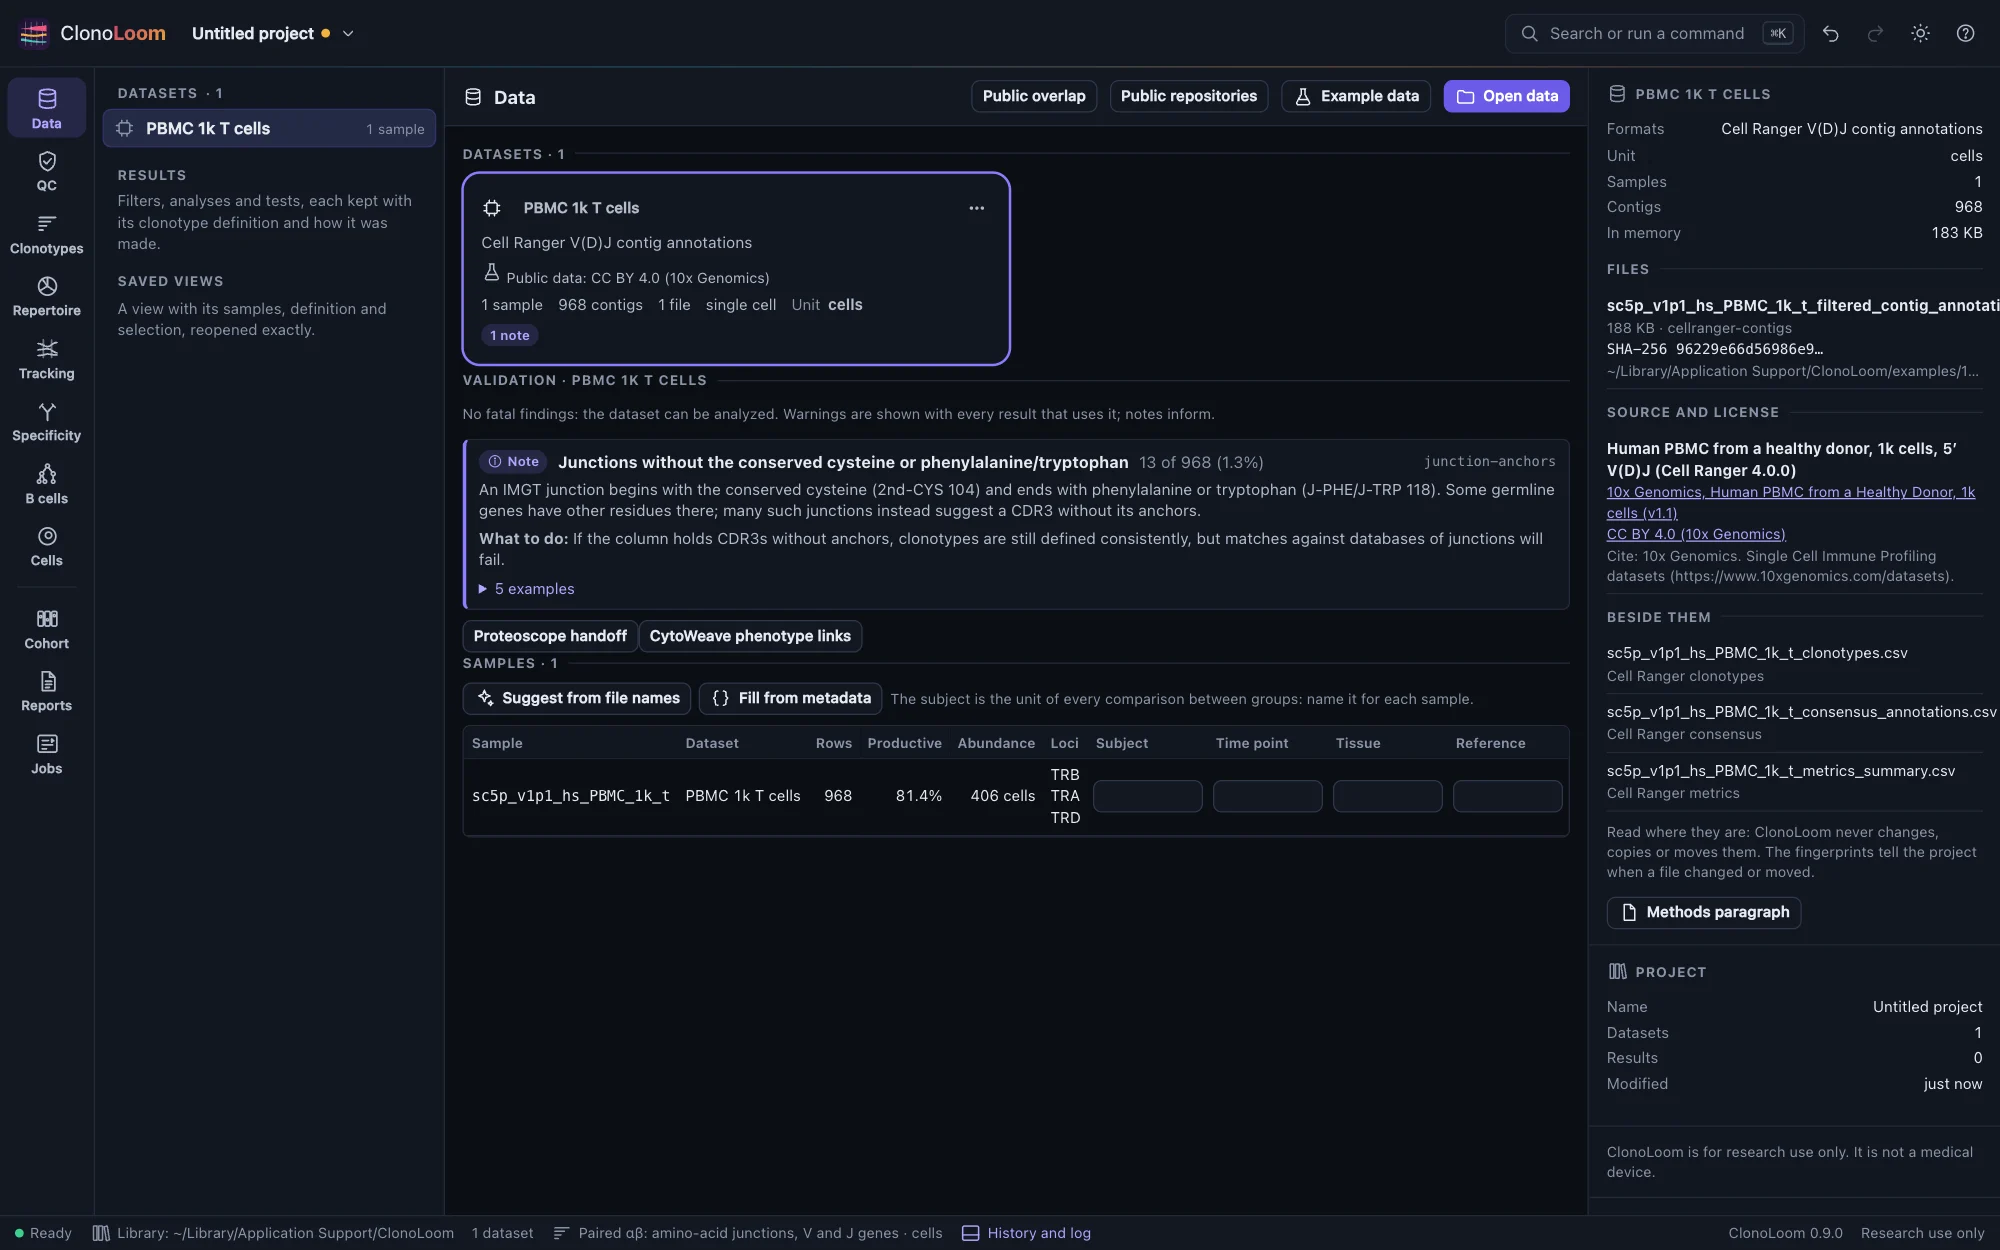
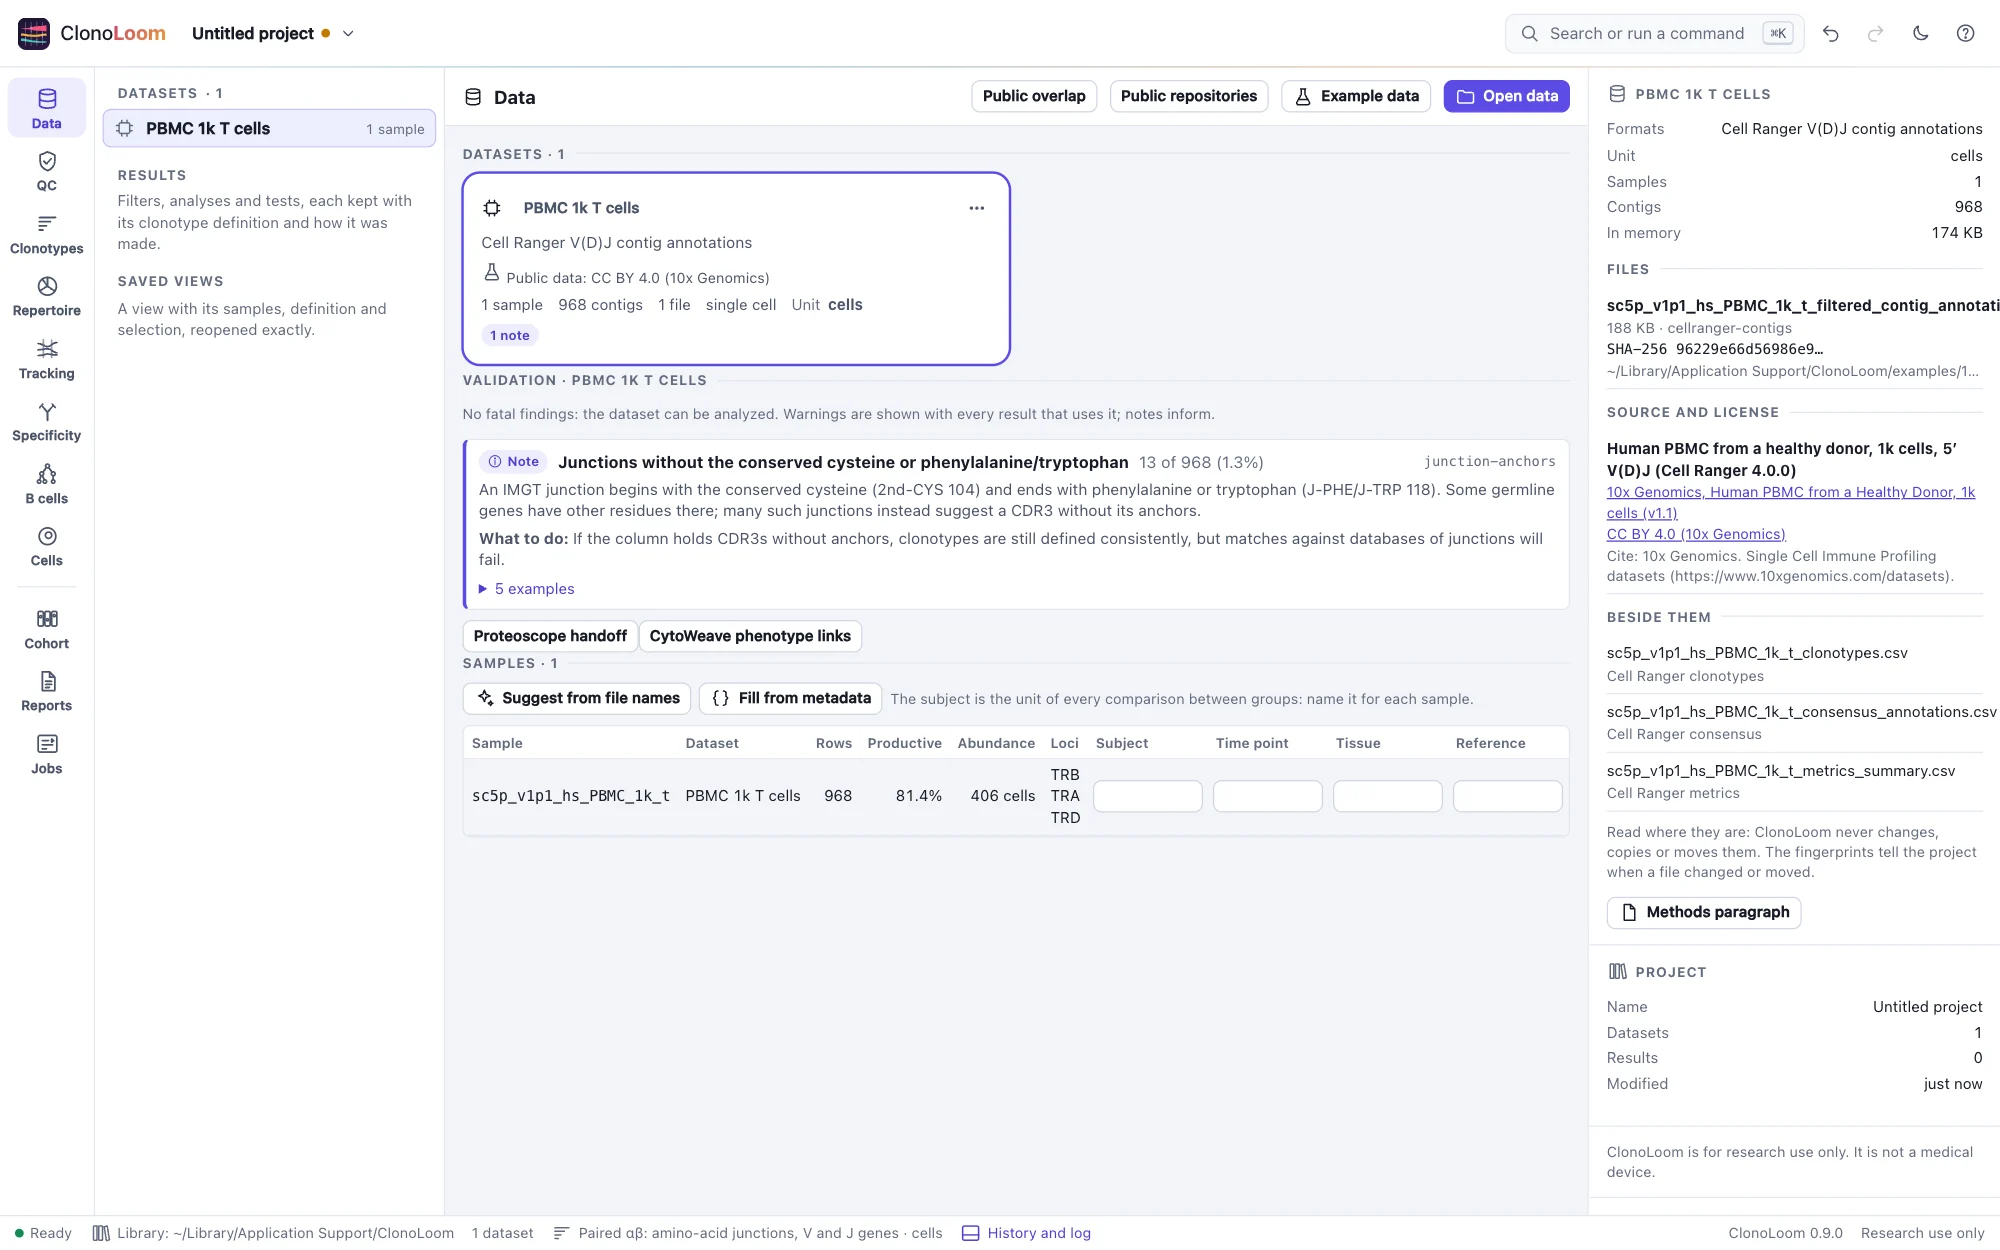
The Data view of 10x Genomics' PBMC 1k T cells: the dataset with its format, unit and the public data's license, the validator's note, the sample, and the file's SHA-256, source and license in the inspectorThe Data view of 10x Genomics' PBMC 1k T cells: the dataset with its format, unit and the public data's license, the validator's note, the sample, and the file's SHA-256, source and license in the inspector
10x Genomics' PBMC 1k T cells checked: the format, the unit, the license, and one note.
Quality control

Each sample's quality, the vendor's numbers recomputed

The QC view measures every sample from its rows: the productive share, clonotypes, singletons, sample coverage, the largest clonotype's share and how well genes were called; for single cells, each cell's chains. Cell Ranger's and immunoSEQ's own numbers are recomputed beside them. Filters are saved as versions, each with its reason, and never change the data.

  • Cell Ranger's cell metrics reproduced exactly for six runs
  • immunoSEQ's clonality, entropy and largest frequency reproduced from its reads
  • Sample coverage equal to iNEXT's to 10⁻¹²
Quality control
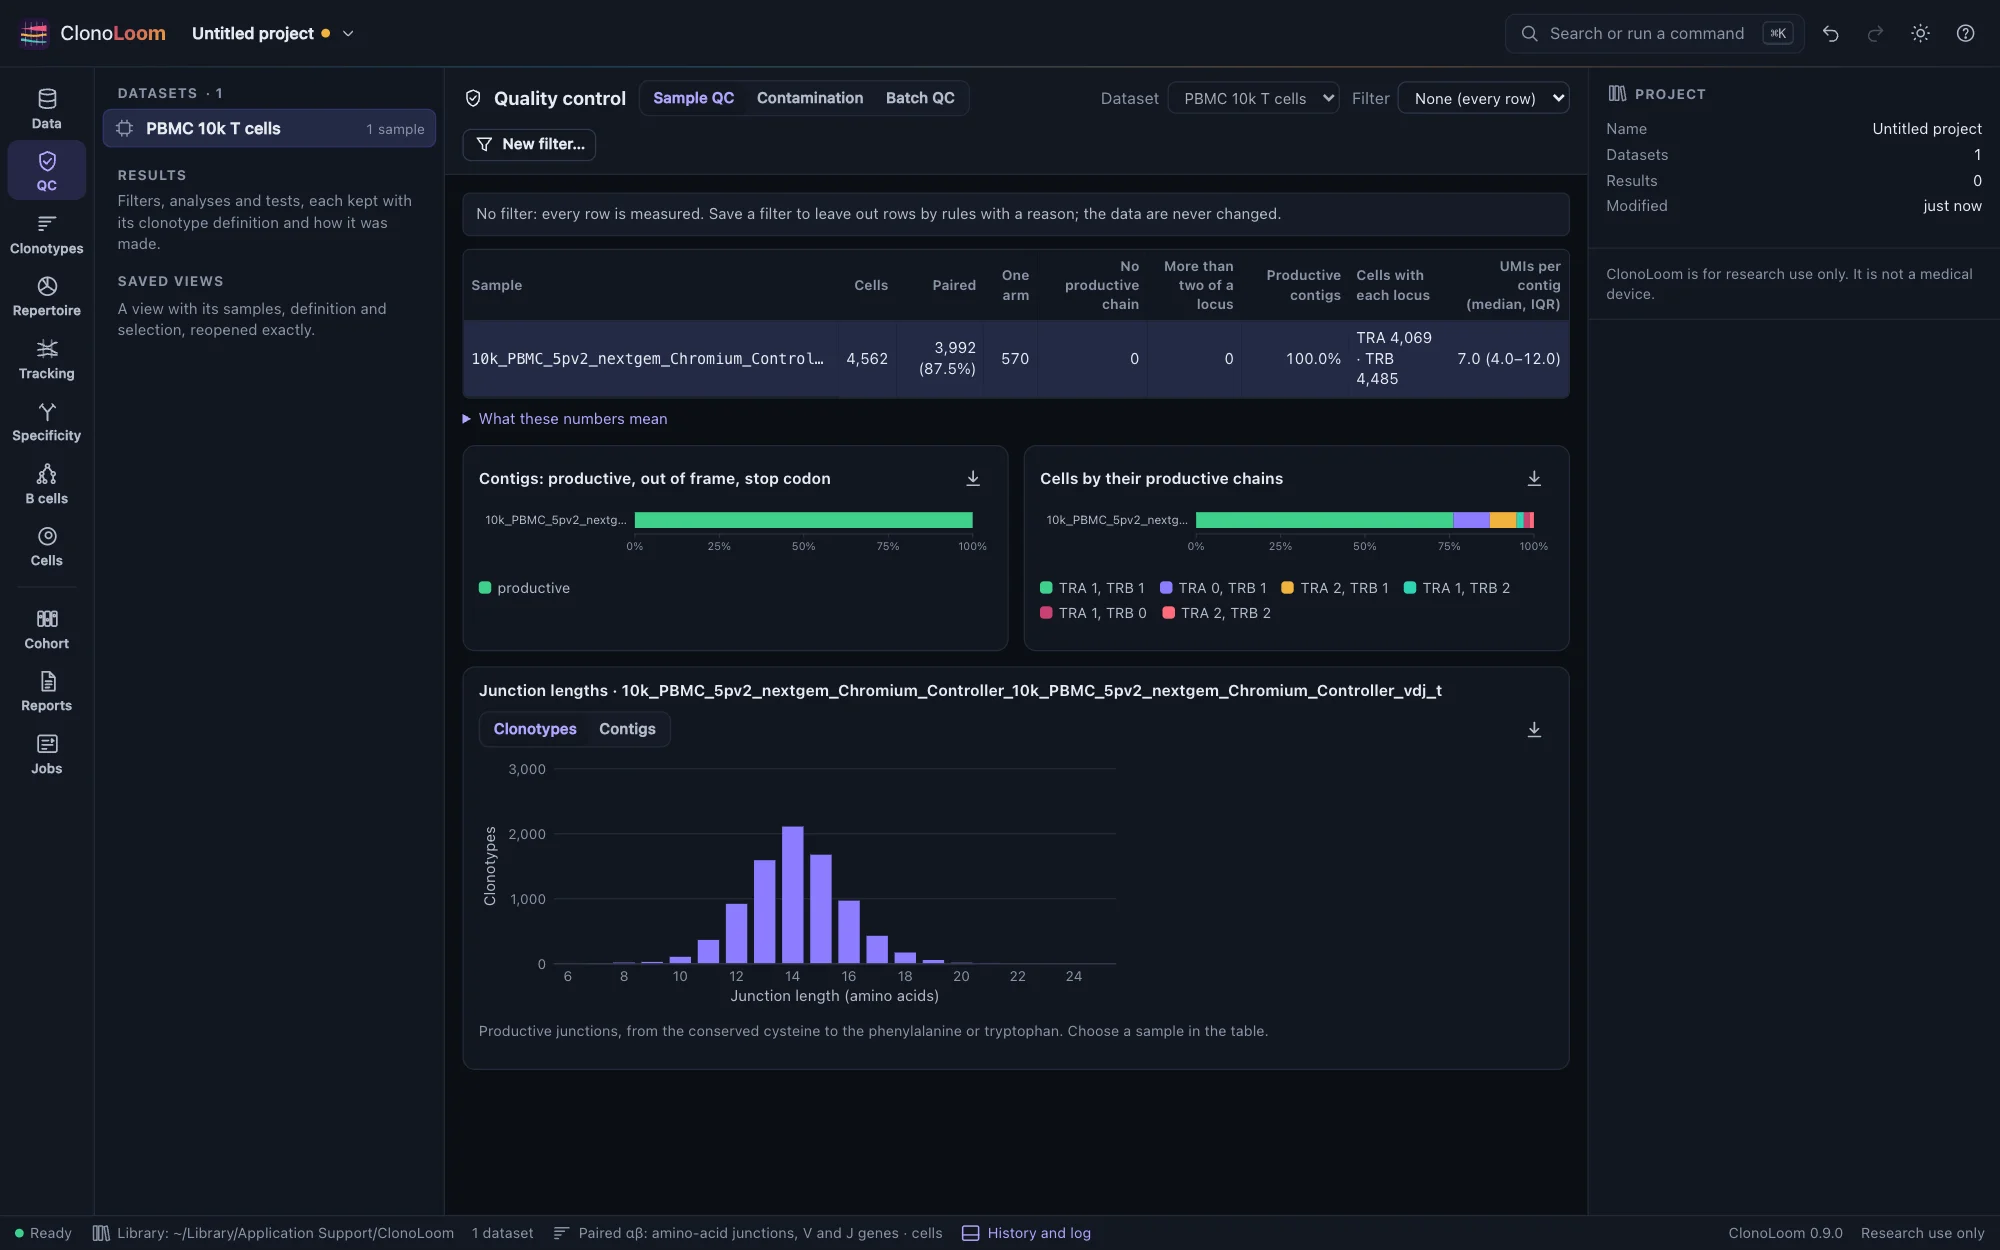
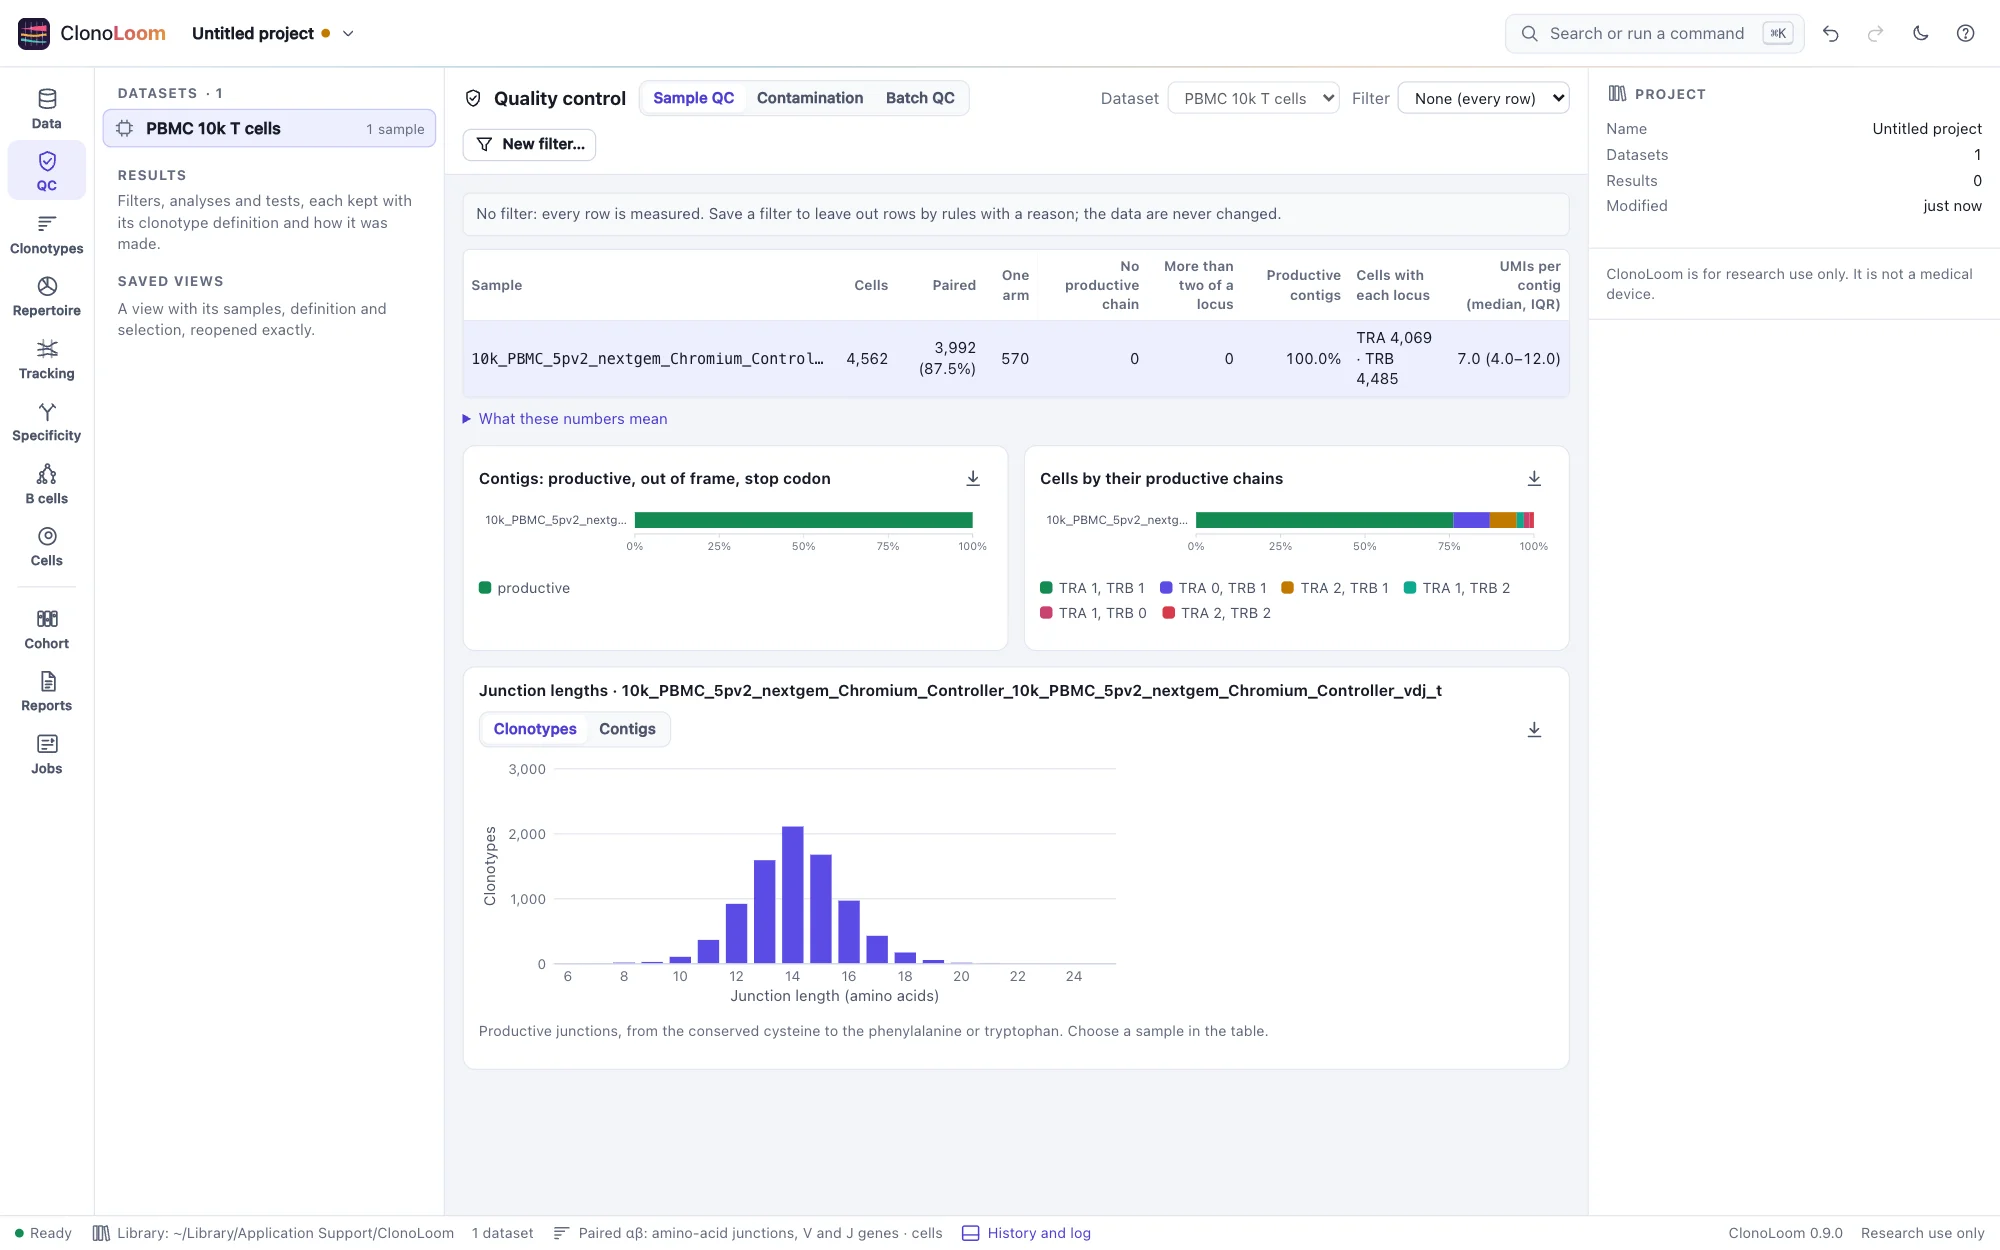
QC of 10x Genomics' 10k PBMC T cells: cells by their productive chains, the share of productive contigs and the junction lengths of the clonotypesQC of 10x Genomics' 10k PBMC T cells: cells by their productive chains, the share of productive contigs and the junction lengths of the clonotypes
10k PBMC T cells: cells by their productive chains, and the junctions' lengths.
Clonotypes

Clonotypes by a definition you can see

Choose a preset or edit a definition: the junction in nucleotides or amino acids, V and J by allele, gene, family or not at all, one chain or paired chains, and what to do with cells that have extra or missing chains. The definition is stated above every table and in the status bar, and each clonotype has an ID made from it, the same in every run.

  • Paired definitions equal to scirpy's partitions of cells on eight Cell Ranger runs
  • Cell Ranger's own clonotypes, or an AIRR file's clone_id, kept as a definition
  • A million clonotypes sorted and searched as they scroll
Clonotypes
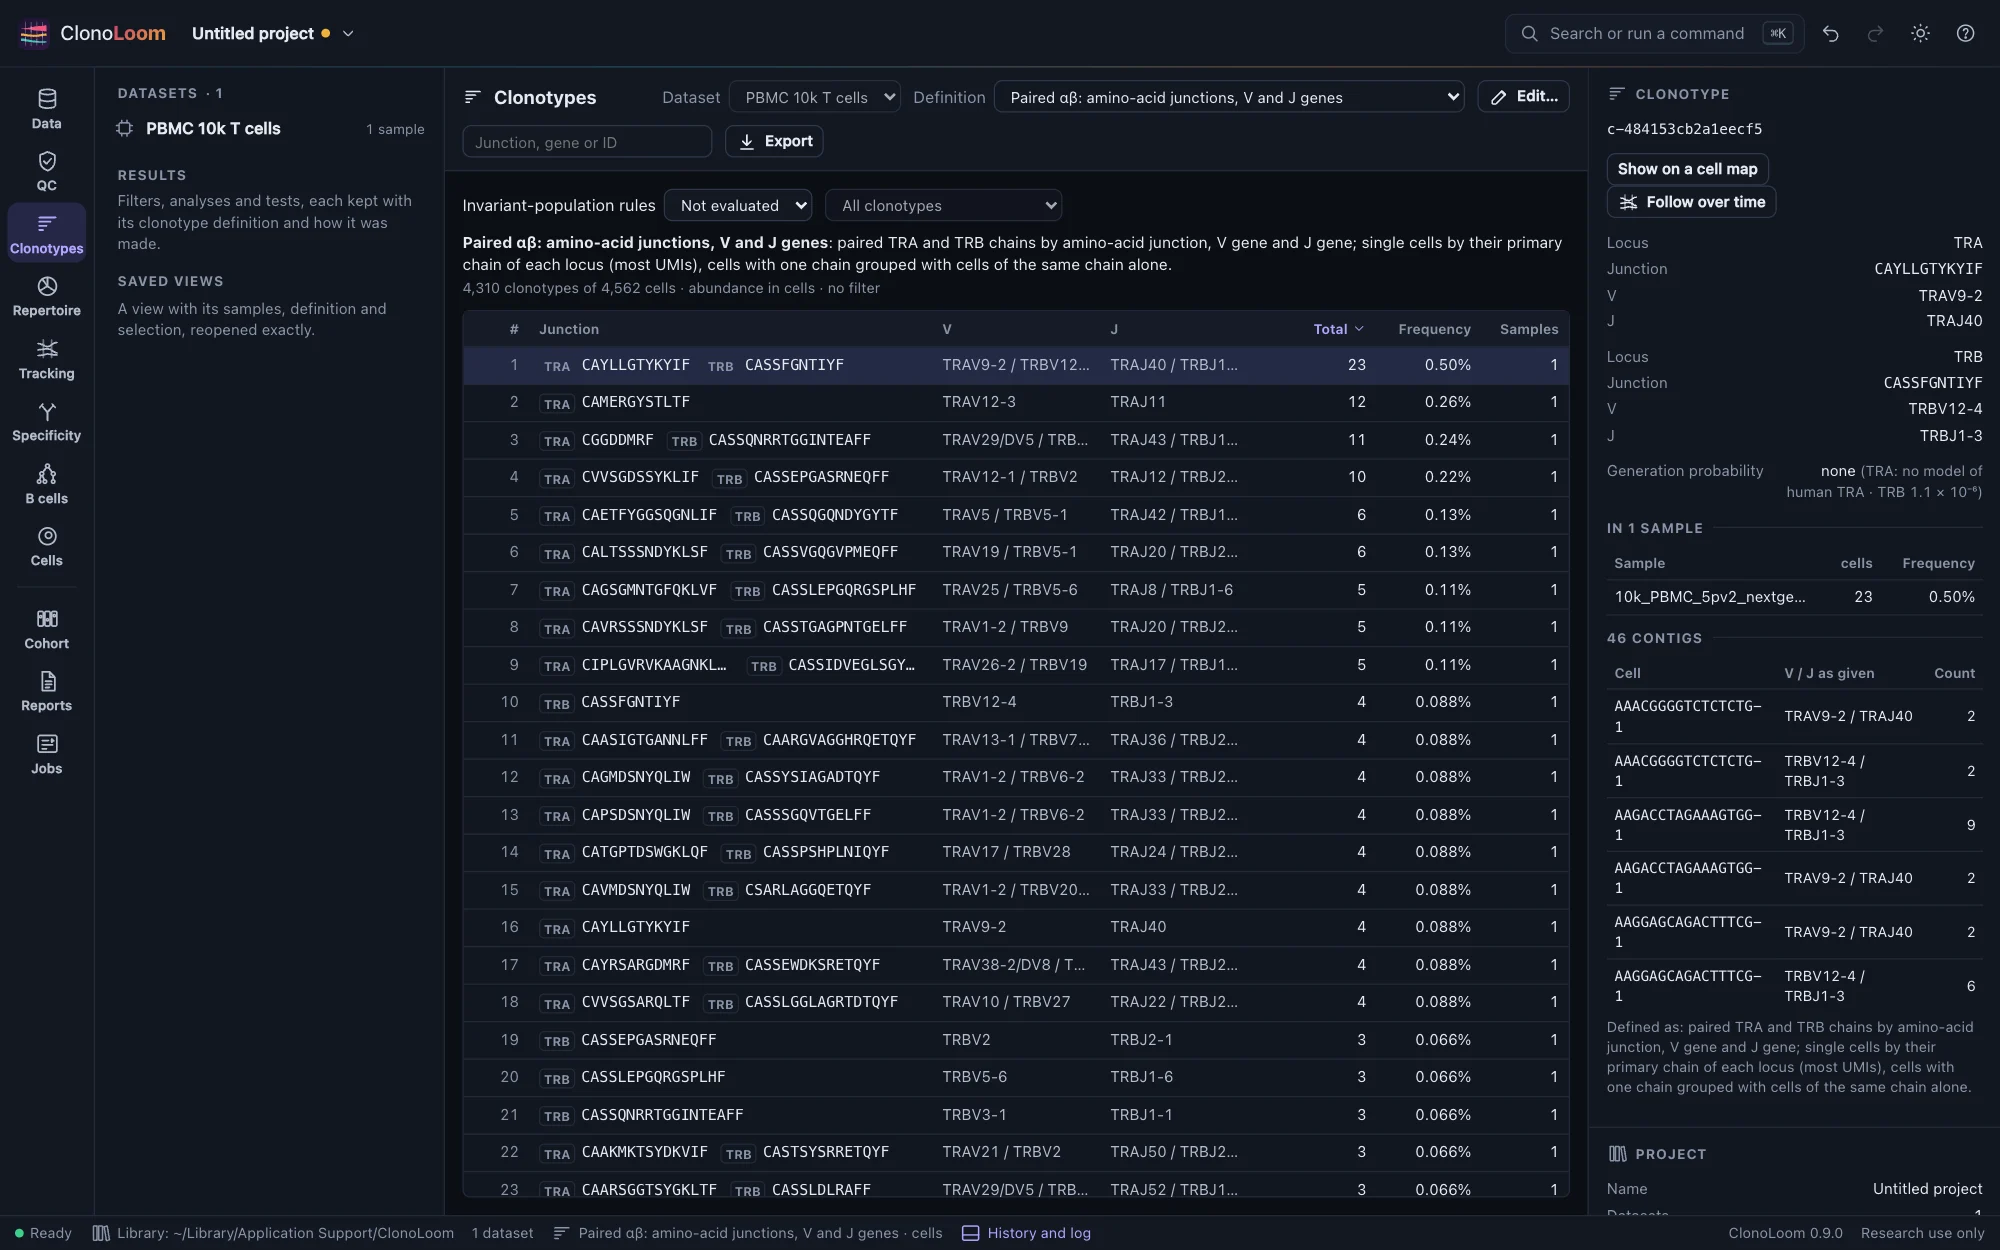
The Clonotypes view: 10k PBMC T cells grouped into paired αβ clonotypes by amino-acid junction, V and J genes, the definition stated above the table, and the largest clonotype's chains and cells in the inspectorThe Clonotypes view: 10k PBMC T cells grouped into paired αβ clonotypes by amino-acid junction, V and J genes, the definition stated above the table, and the largest clonotype's chains and cells in the inspector
10k T cells as paired αβ clonotypes, the largest one's chains and cells in the inspector.
Diversity and rarefaction

Diversity with its uncertainty, compared fairly

Hill numbers, Chao1, ACE, the Shannon and Simpson diversity of the repertoire a sample was drawn from, clonality, Gini and clonal space homeostasis, each with a 95% interval. Rarefaction and extrapolation show what each sample would hold at any size or coverage, and compare the samples at a level every one of them reaches.

  • Equal to iNEXT, immunarch and vegan on 18 samples
  • Curves within 10⁻⁹ of iNEXT's at its 40 sizes along each
  • How often the intervals hold a simulated truth, measured and stated
Diversity
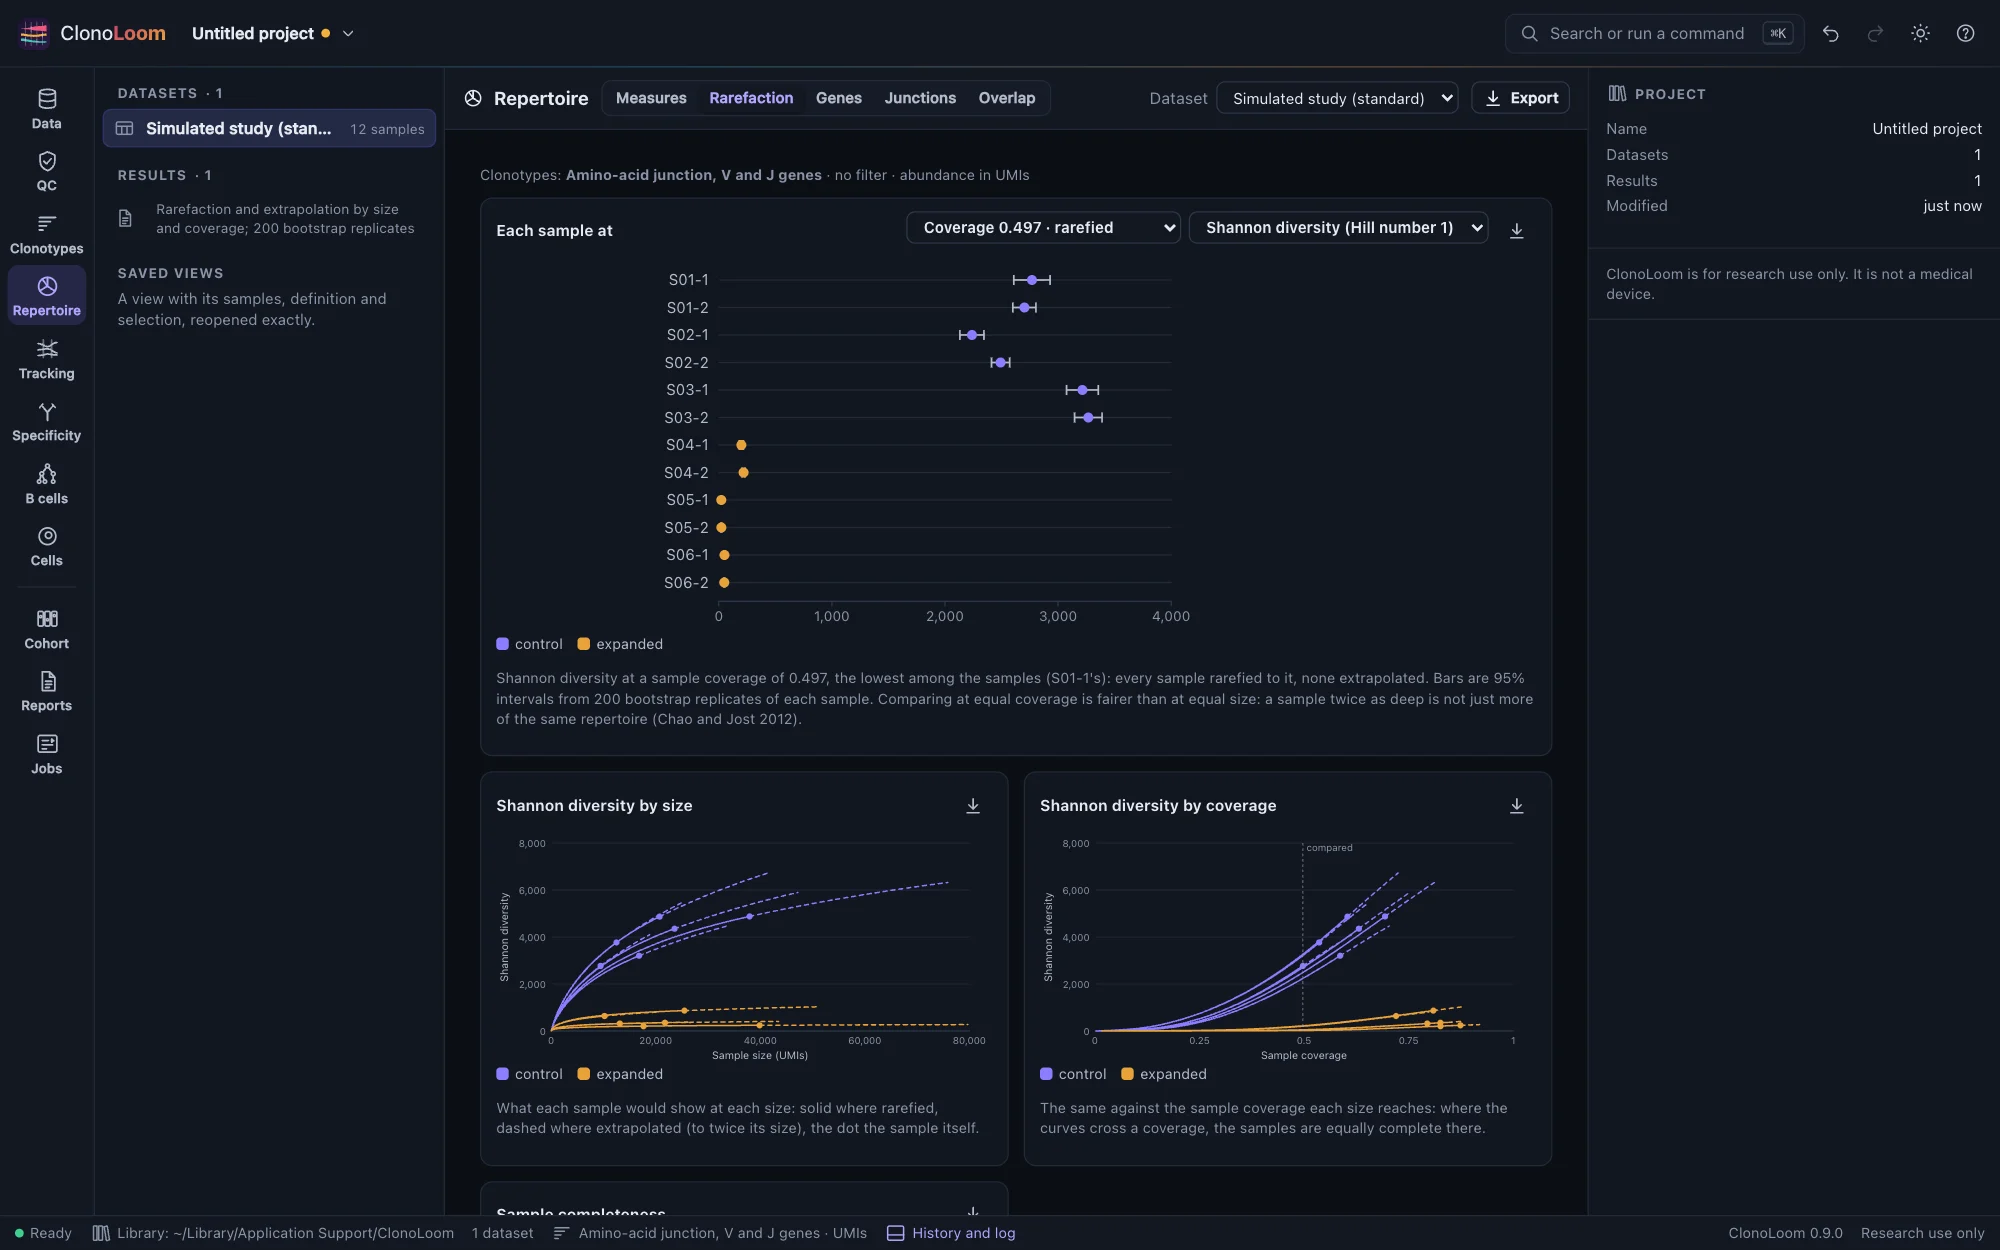
The Rarefaction part: each sample's Shannon diversity at the lowest coverage among them, with 95% intervals, and the curves by size and by coverage, solid where rarefied and dashed where extrapolatedThe Rarefaction part: each sample's Shannon diversity at the lowest coverage among them, with 95% intervals, and the curves by size and by coverage, solid where rarefied and dashed where extrapolated
Twelve samples compared at the lowest coverage among them, with their curves by size and coverage.
Genes and junctions

What the clonotypes are made of

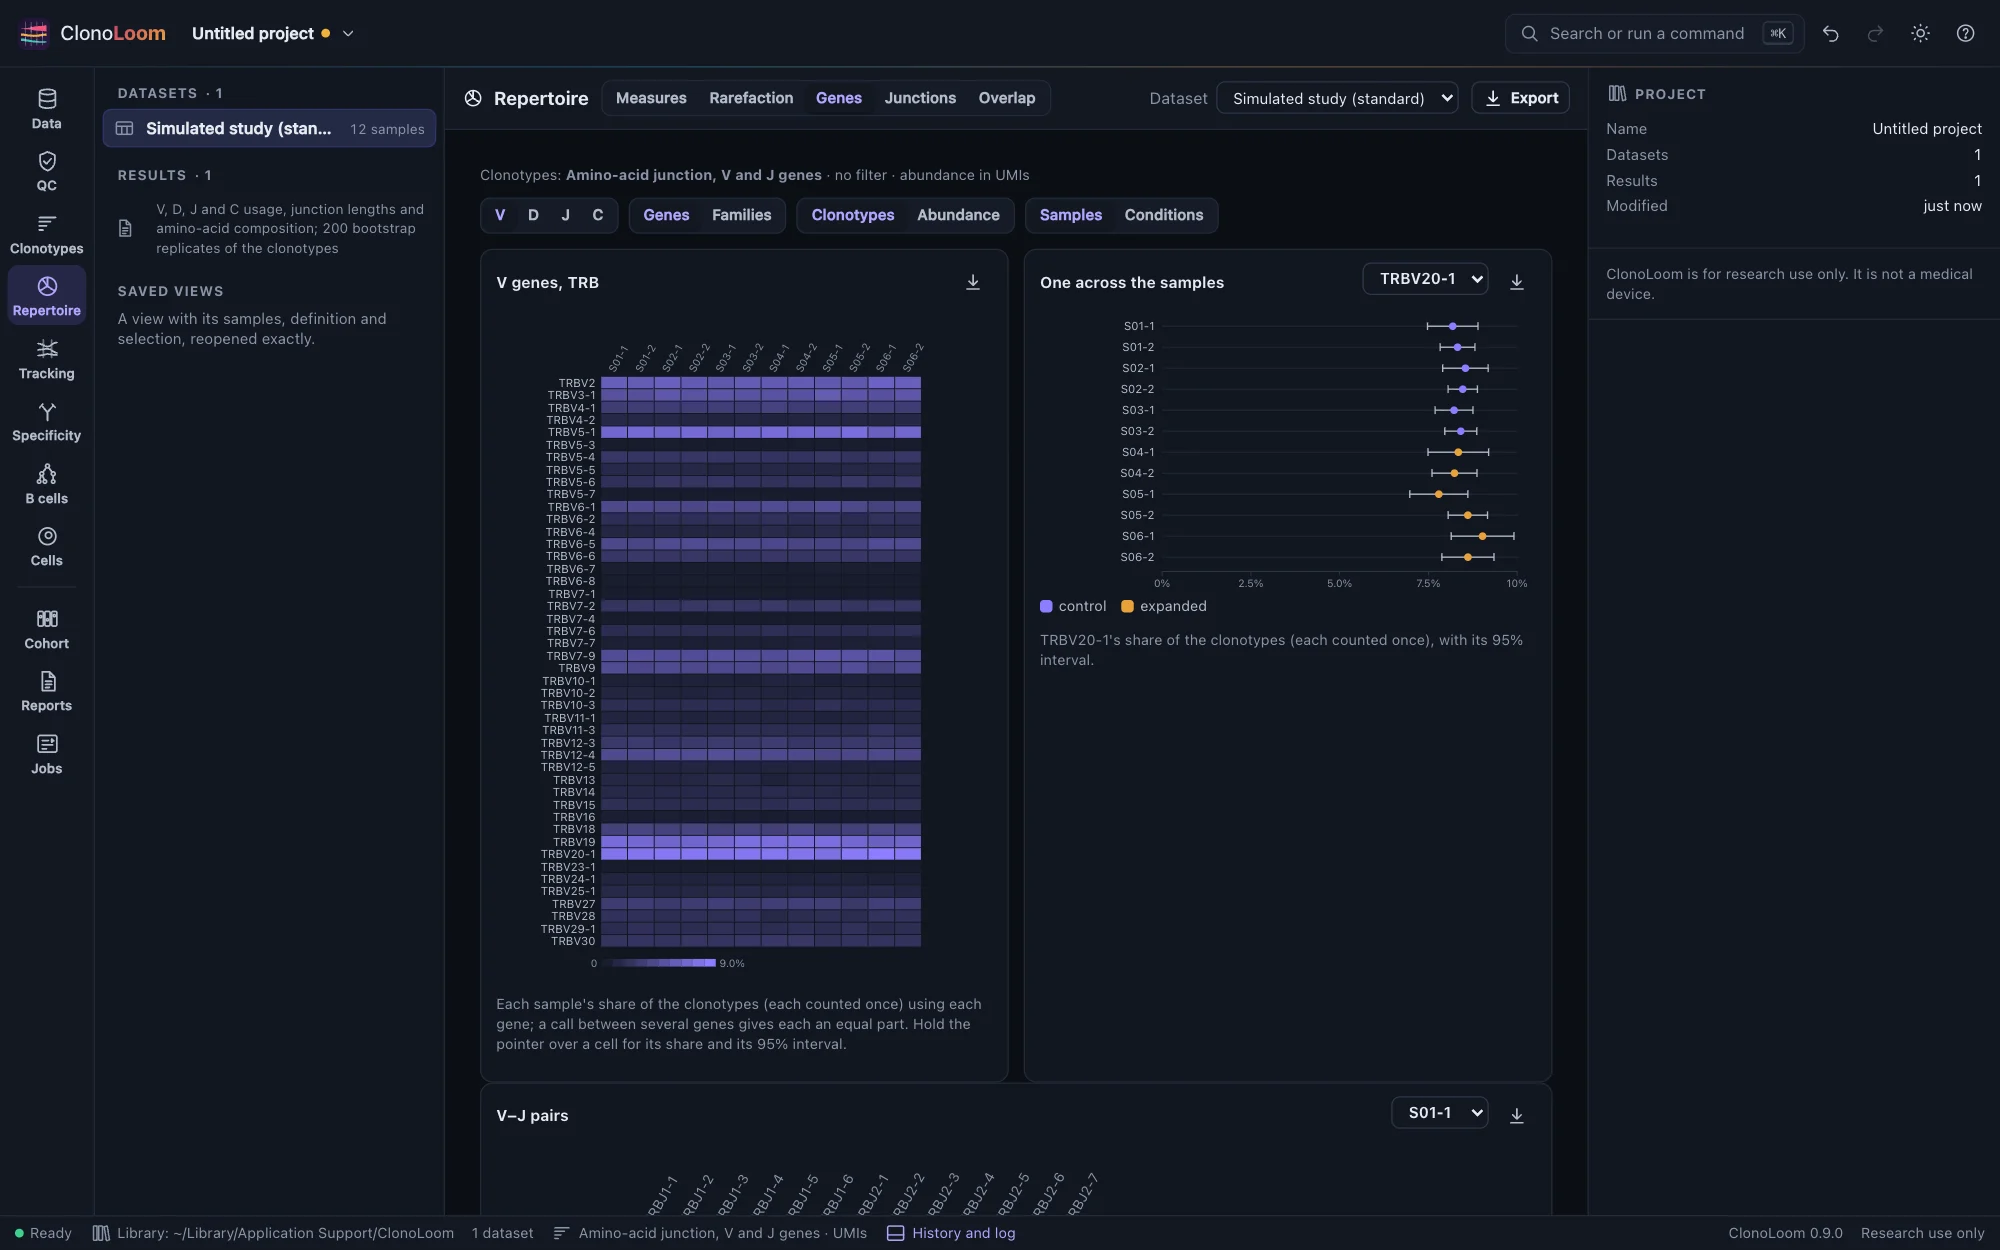
Each sample's V, D, J and C genes and their families, V–J pairs, junction lengths and amino acids, overall and at each IMGT position; by clonotypes or by abundance, for each sample or each condition, with intervals from a bootstrap of the clonotypes.

  • 8,277 shares equal to an independent R implementation to 10⁻¹²
  • A call tied between genes shared between them, what was not called said
  • Intervals that held the simulator's truth in 97.4% to 100% of cases
Genes and junctions
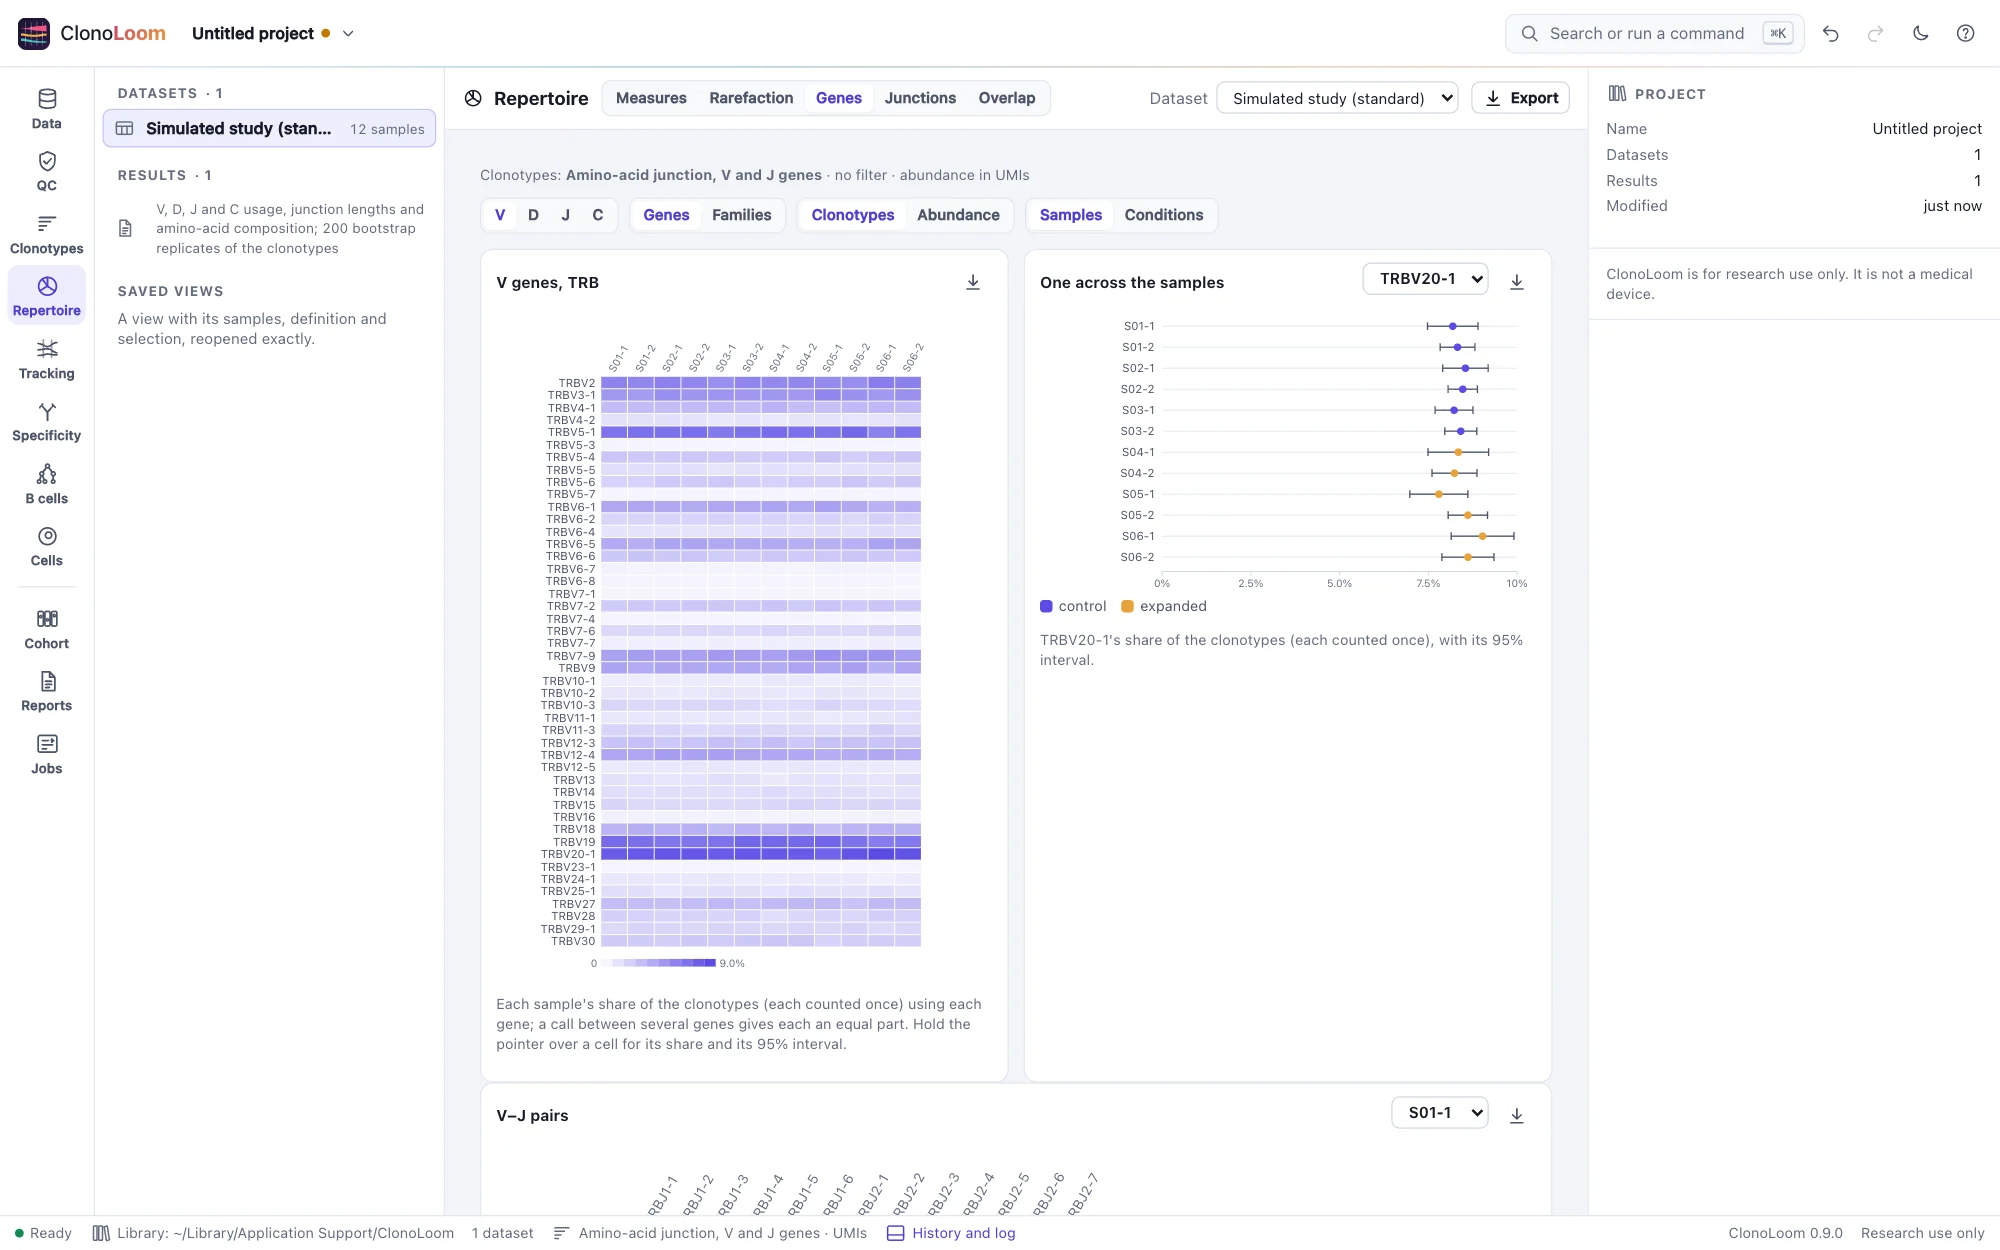
The Genes part: a heatmap of each sample's TRBV gene usage by clonotypes, and one gene's share across the samples with 95% intervalsThe Genes part: a heatmap of each sample's TRBV gene usage by clonotypes, and one gene's share across the samples with 95% intervals
Each sample's V genes, and one gene across the samples.
Overlap

Samples compared with each other

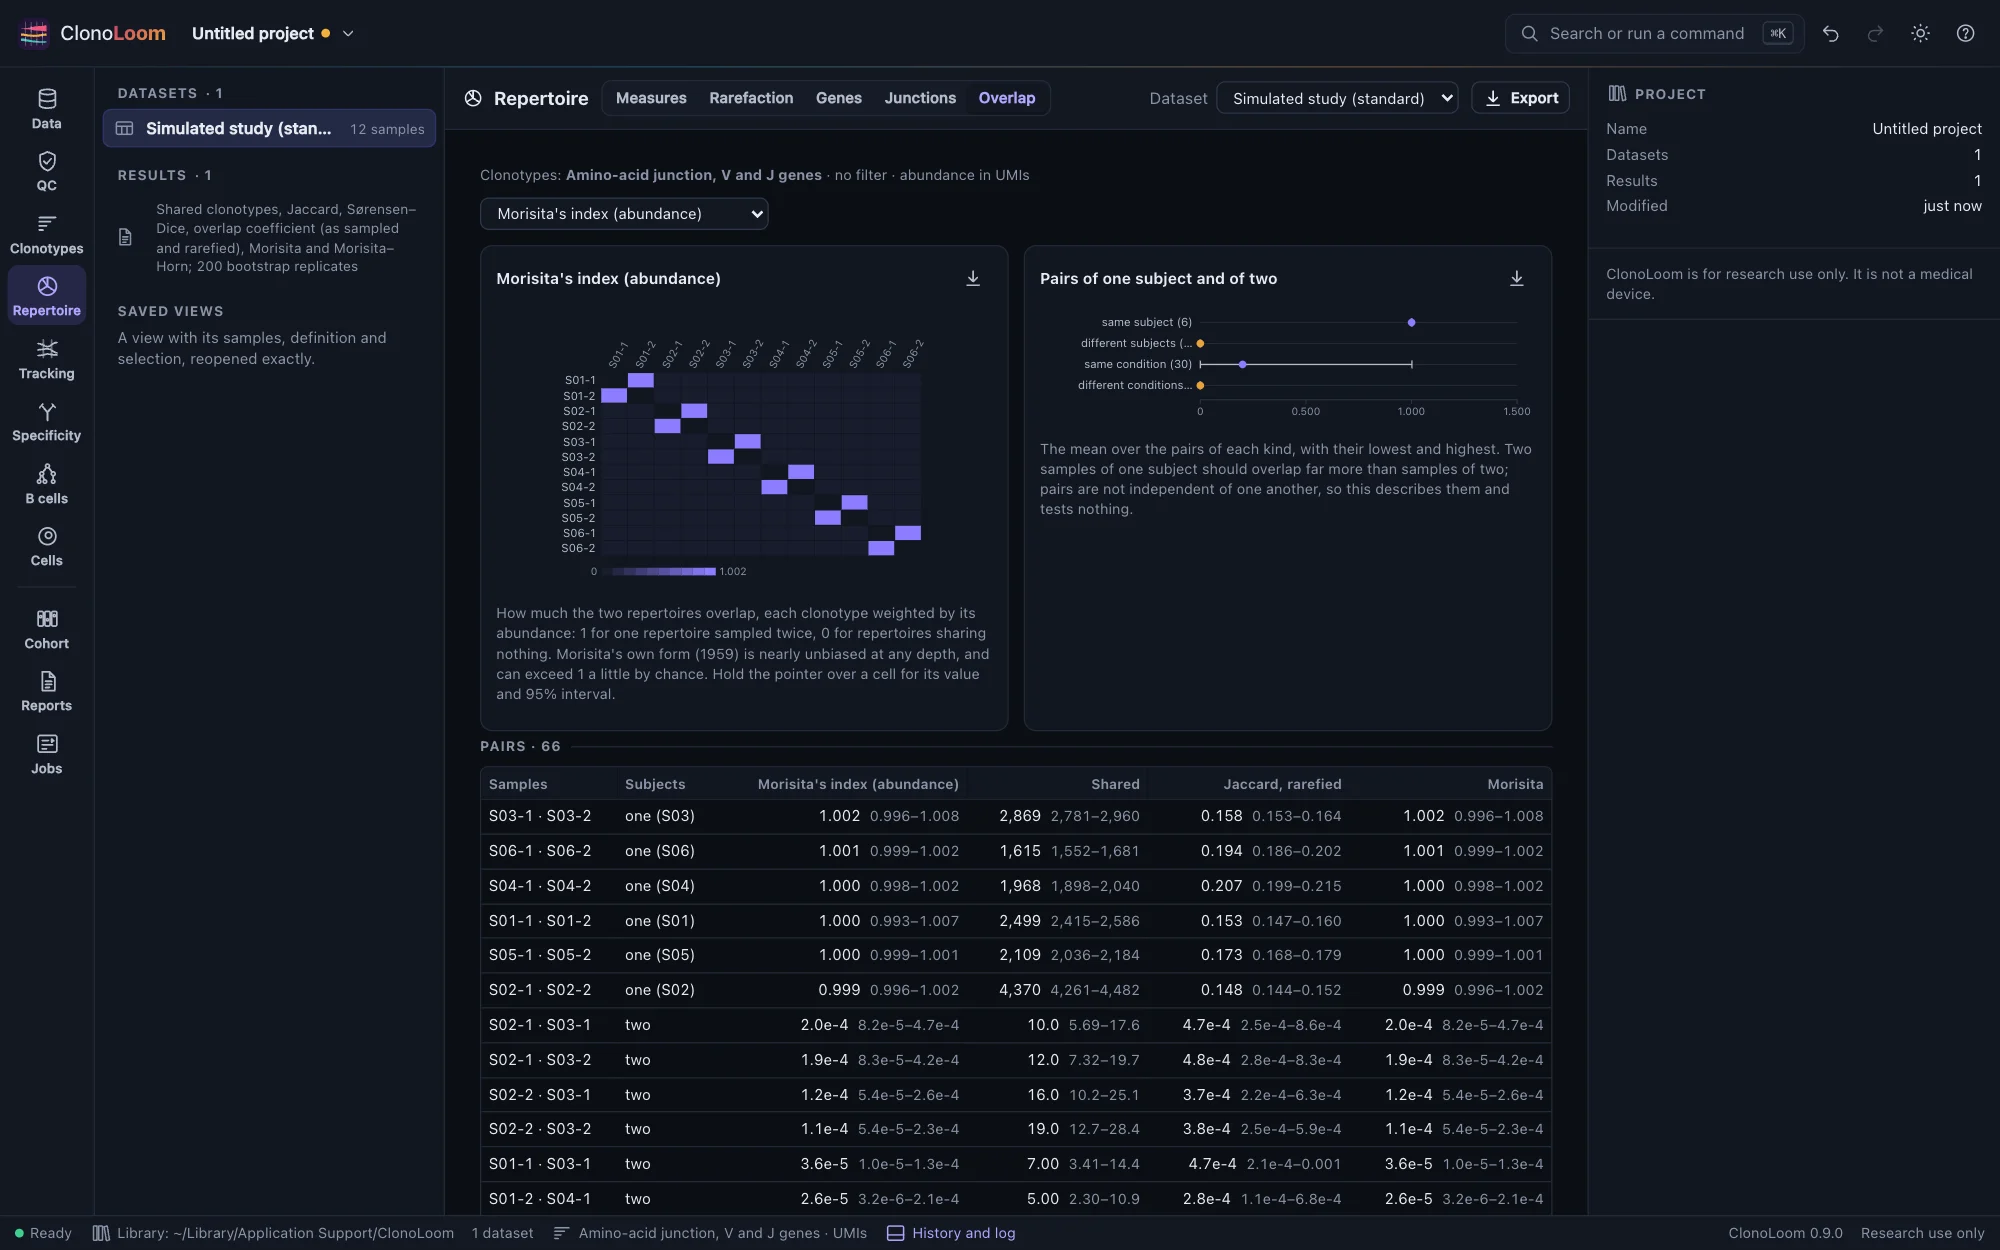
For every pair of samples: the clonotypes they share, Jaccard's and Sørensen–Dice's indices and the overlap coefficient, as sampled and rarefied to the same depth, and Morisita's index over their abundances. The pairs of one subject and of two are summarized, and the clonotypes found in more than one subject are counted.

  • Equal to immunarch, vegan and R on 69 pairs, and to scirpy on four single-cell runs
  • Intervals widened for the chance that decides which clonotypes two samples share
  • Those intervals held the truth in 95.2% of 330 simulated pairs
Overlap
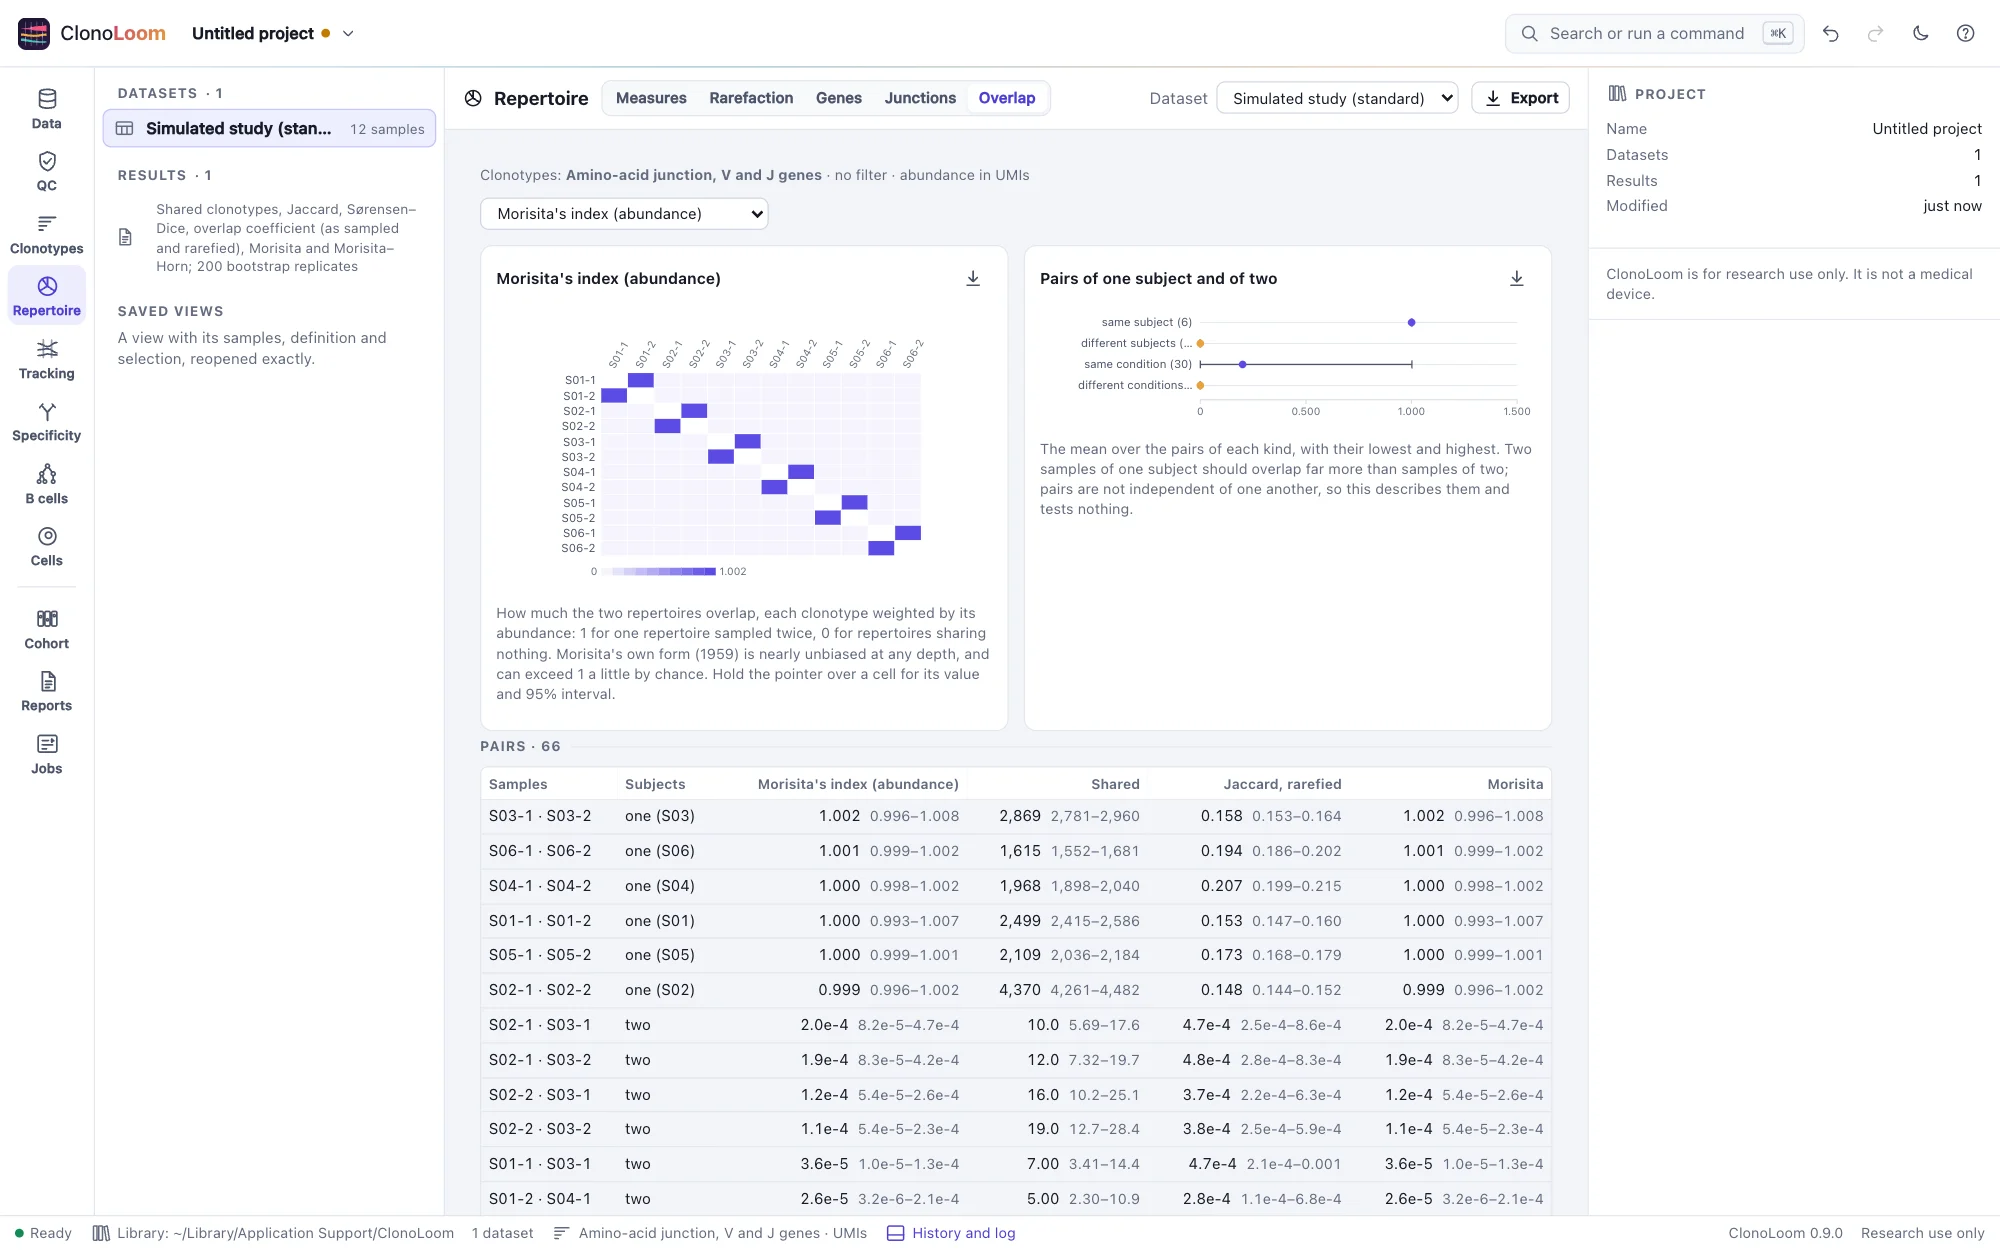
The Overlap part: Morisita's index for every pair of samples as a heatmap, the pairs of one subject and of two summarized, and every pair listed with its intervalsThe Overlap part: Morisita's index for every pair of samples as a heatmap, the pairs of one subject and of two summarized, and every pair listed with its intervals
Every pair of twelve samples by Morisita's index; the two samples of each subject stand out.
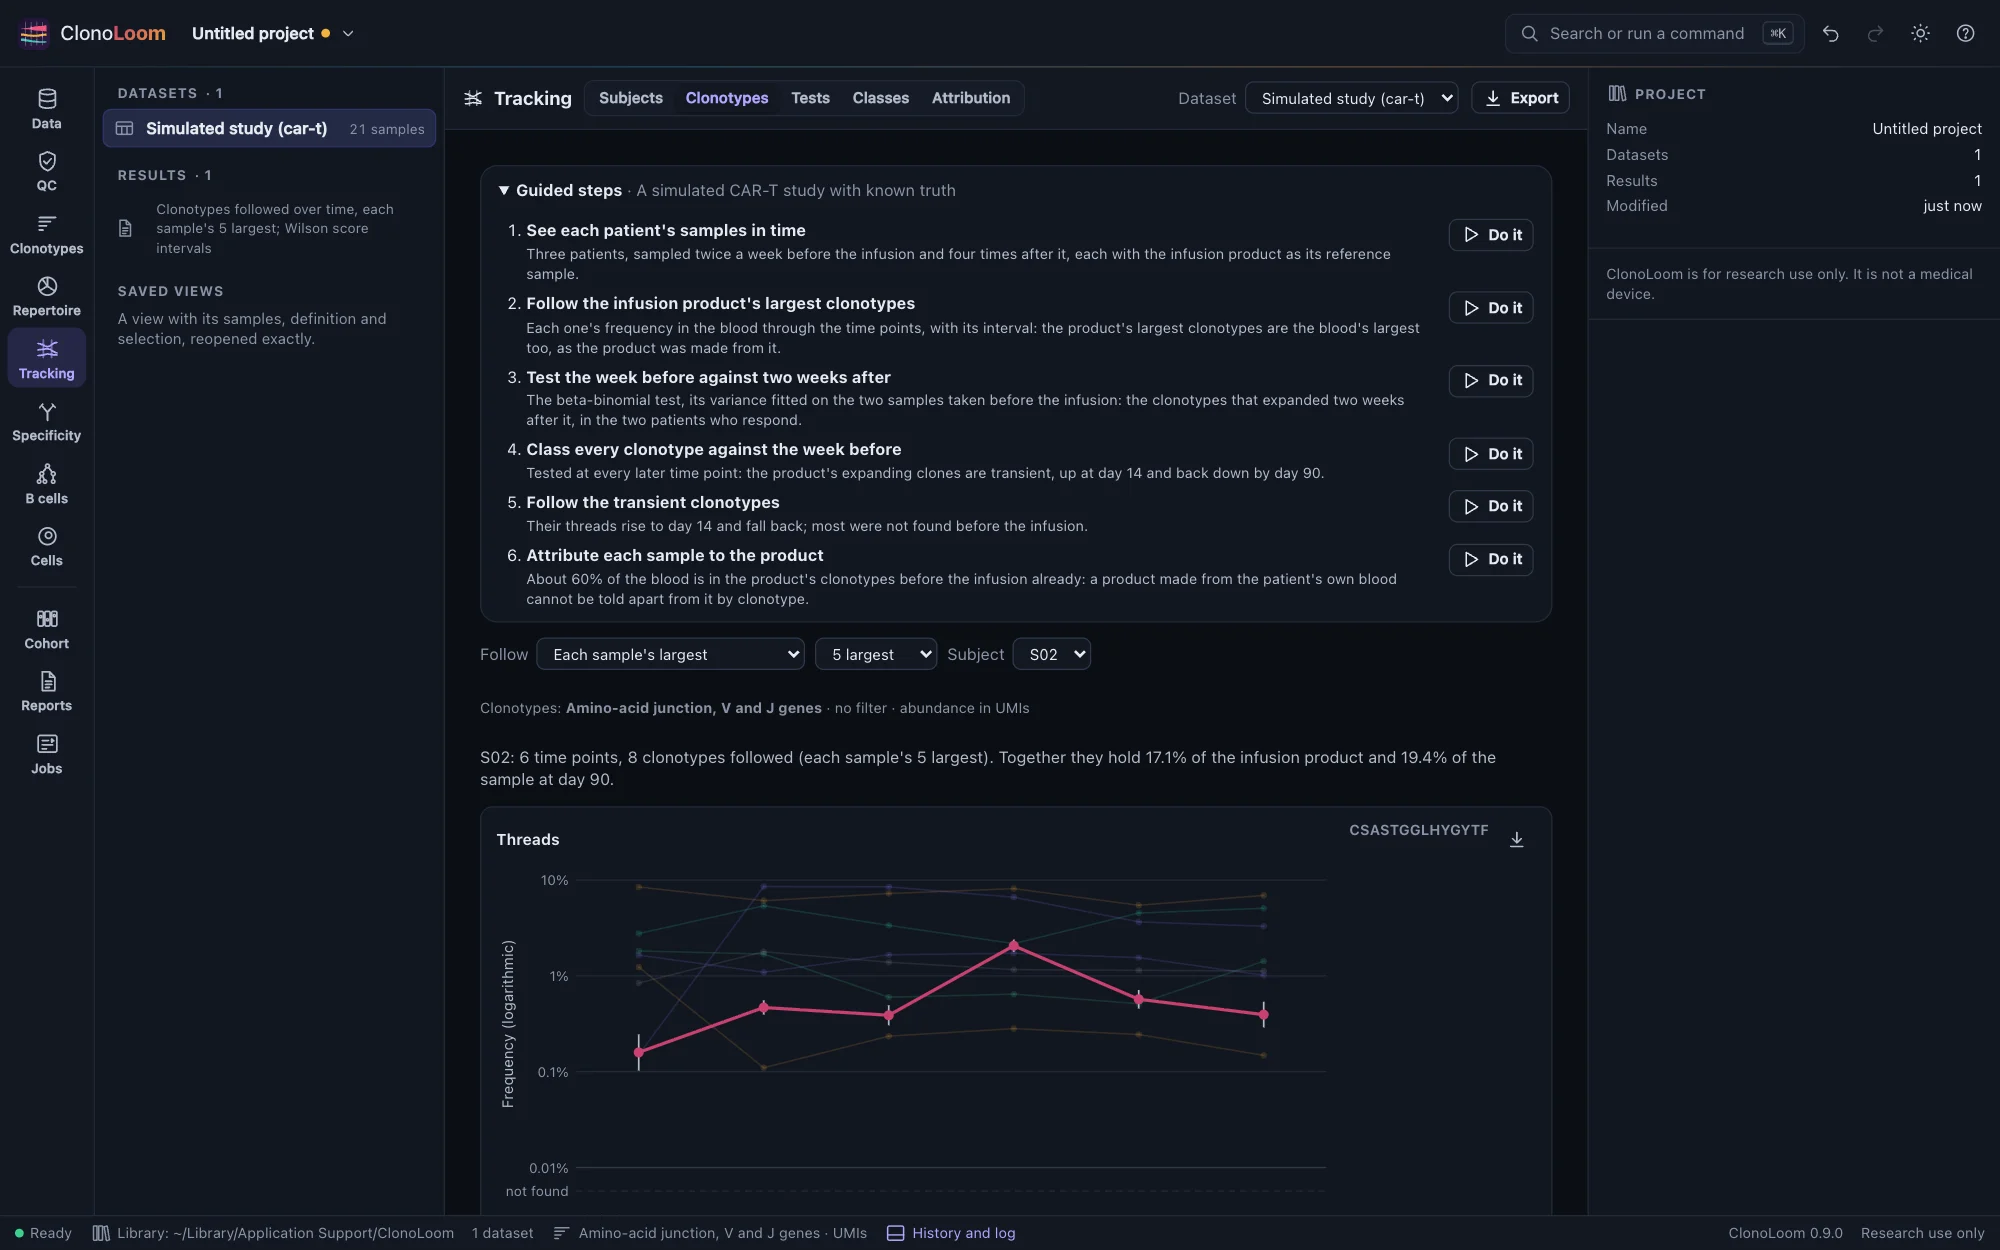
Tracking

Clonotypes followed through time, and tested

Each subject's samples placed in time from their annotation or metadata. Its clonotypes followed through the time points with their intervals, as threads and alluvial plots; tested between two time points by the beta-binomial test, its variance between blood samples fitted on replicate samples, with false discoveries controlled; classed across several; and each sample measured against an infusion product or a donor.

  • Every p-value equal to R's, or an independent R implementation's, to 4 × 10⁻¹²
  • No false call where nothing changes, where the binomial test makes some
  • A donor's share of the blood within 0.065 of the truth
Expanded and contracted clonotypes
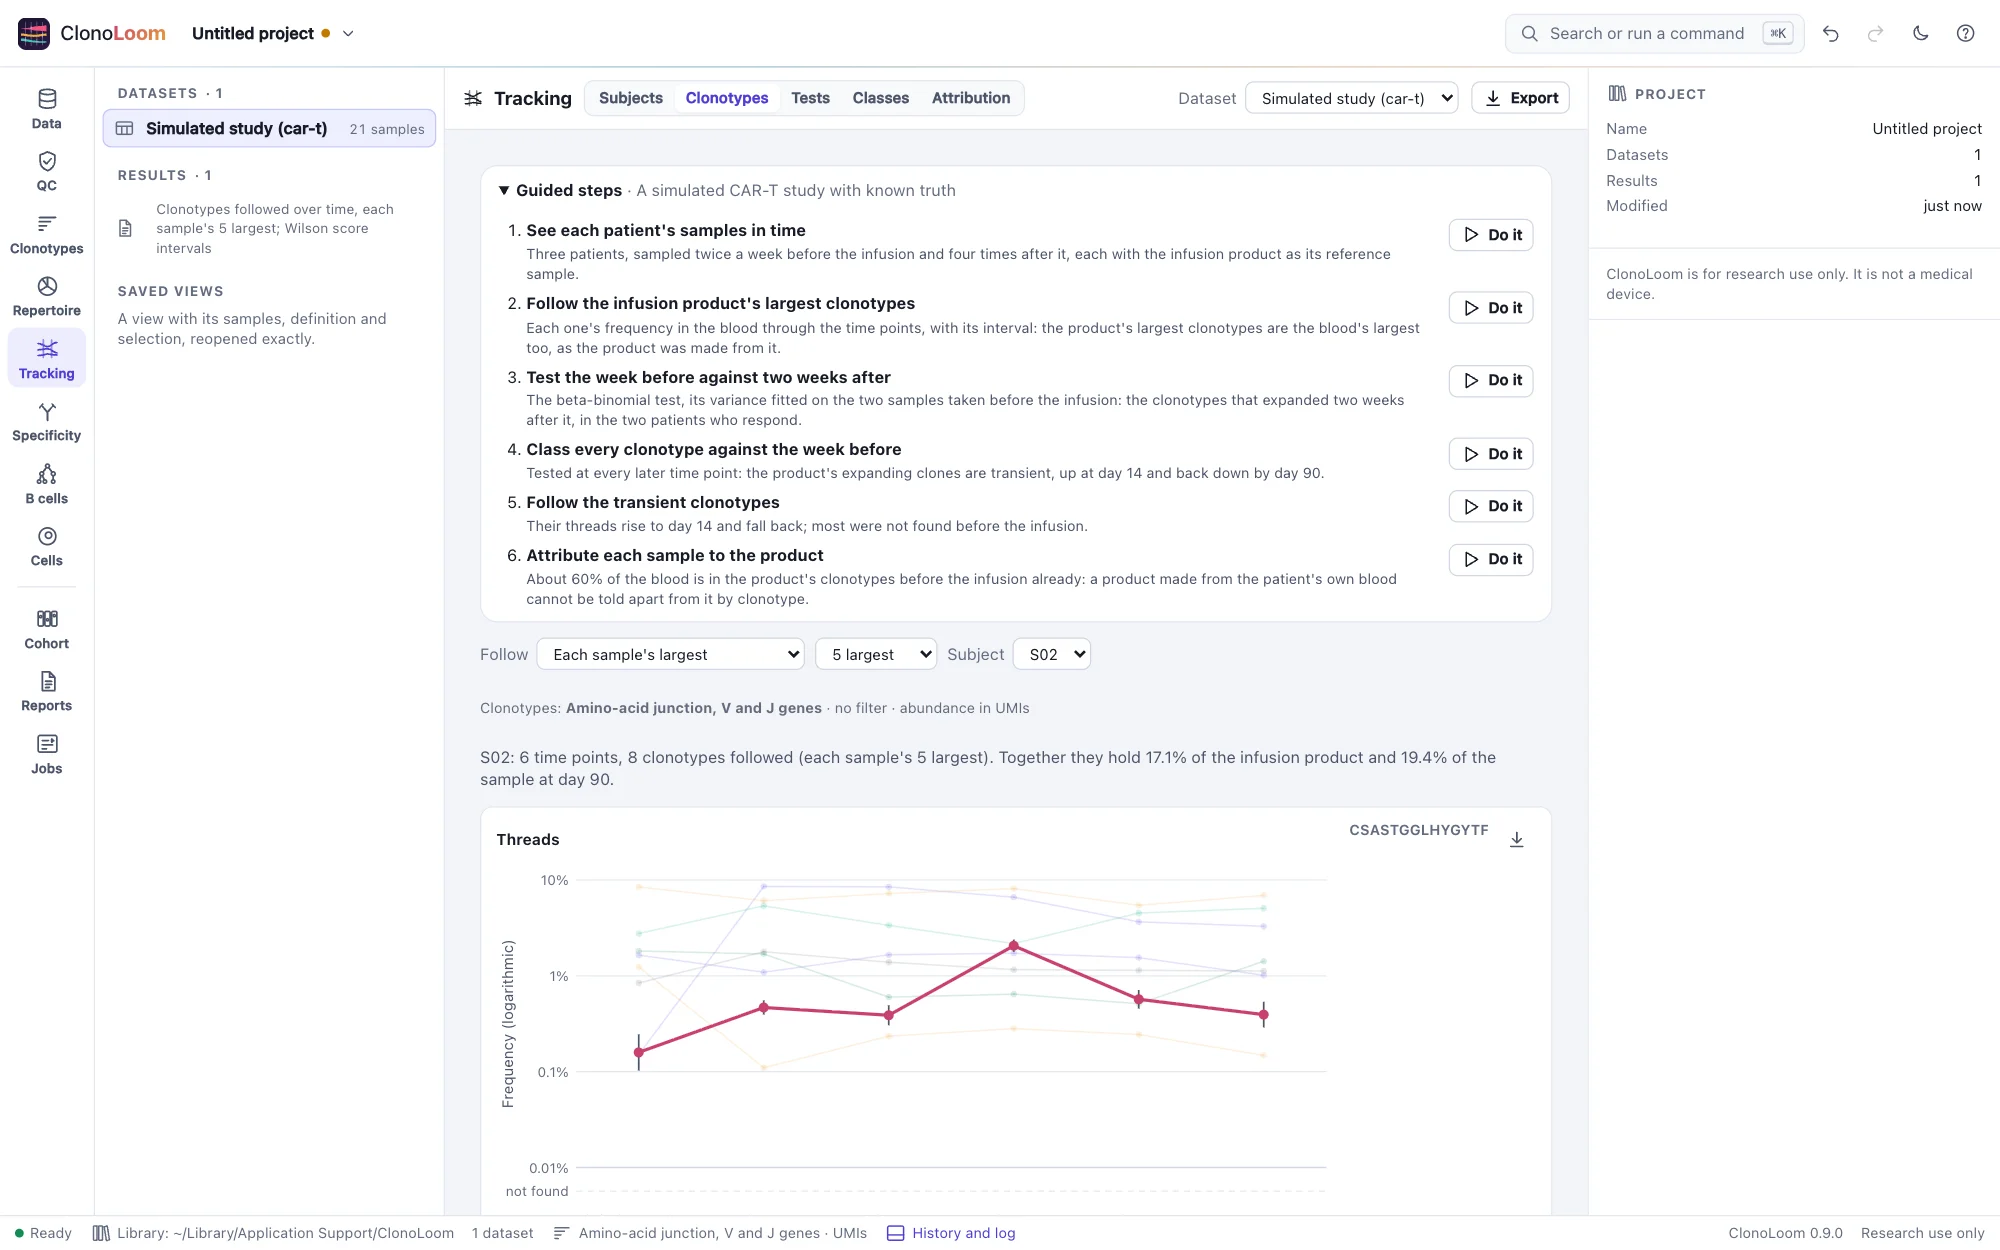
The Tracking view's Clonotypes part on the simulated CAR-T study: each sample's five largest clonotypes of one patient as threads through the infusion product and six time points, the one that peaks at day 14 chosen and drawn with its intervals, and an alluvial plot of their shares belowThe Tracking view's Clonotypes part on the simulated CAR-T study: each sample's five largest clonotypes of one patient as threads through the infusion product and six time points, the one that peaks at day 14 chosen and drawn with its intervals, and an alluvial plot of their shares below
A simulated CAR-T patient's largest clonotypes through time, one drawn with its intervals.
Figures, exports and the record

Results others can check

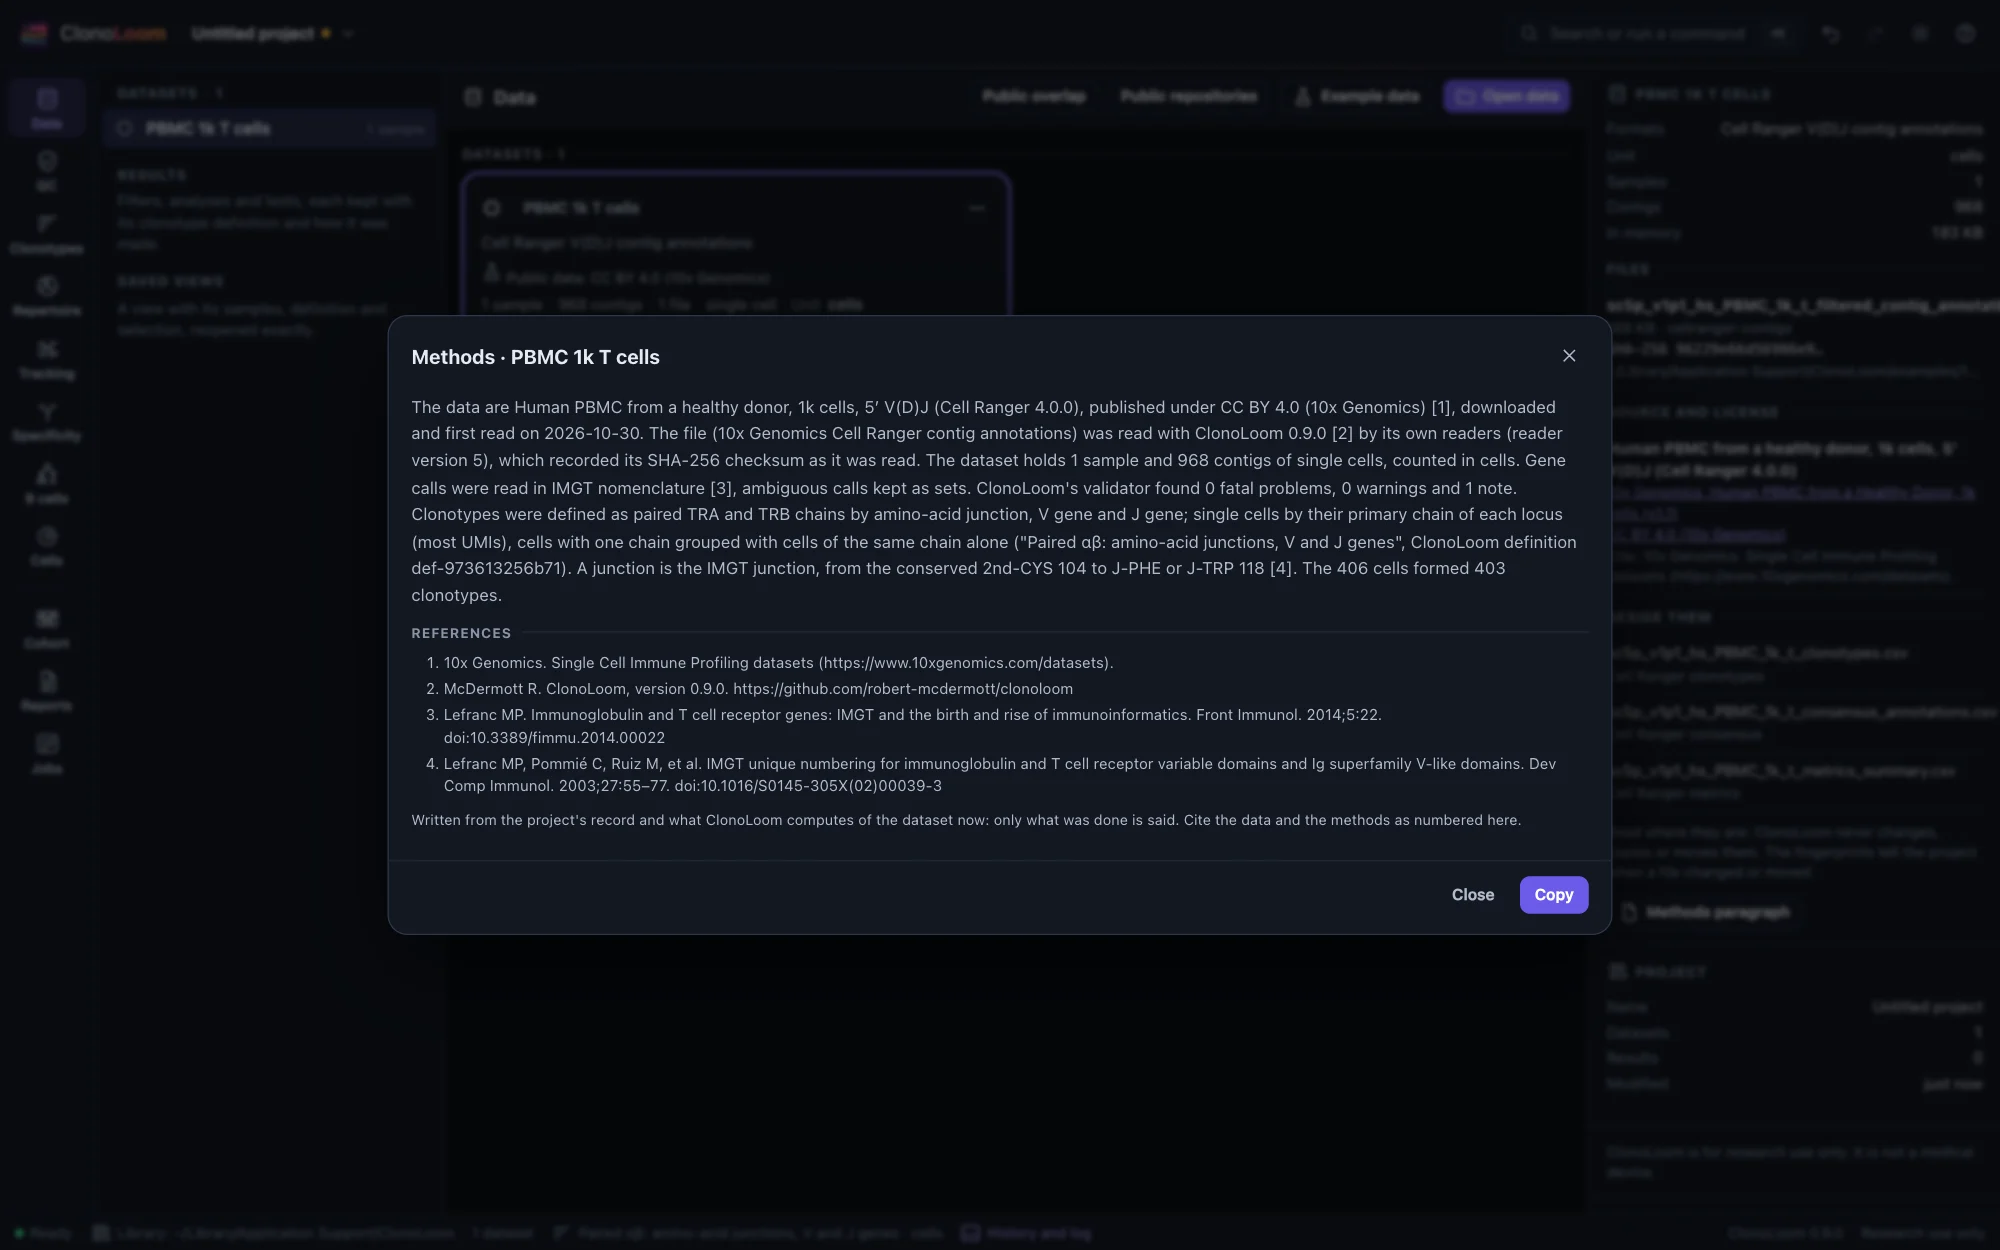
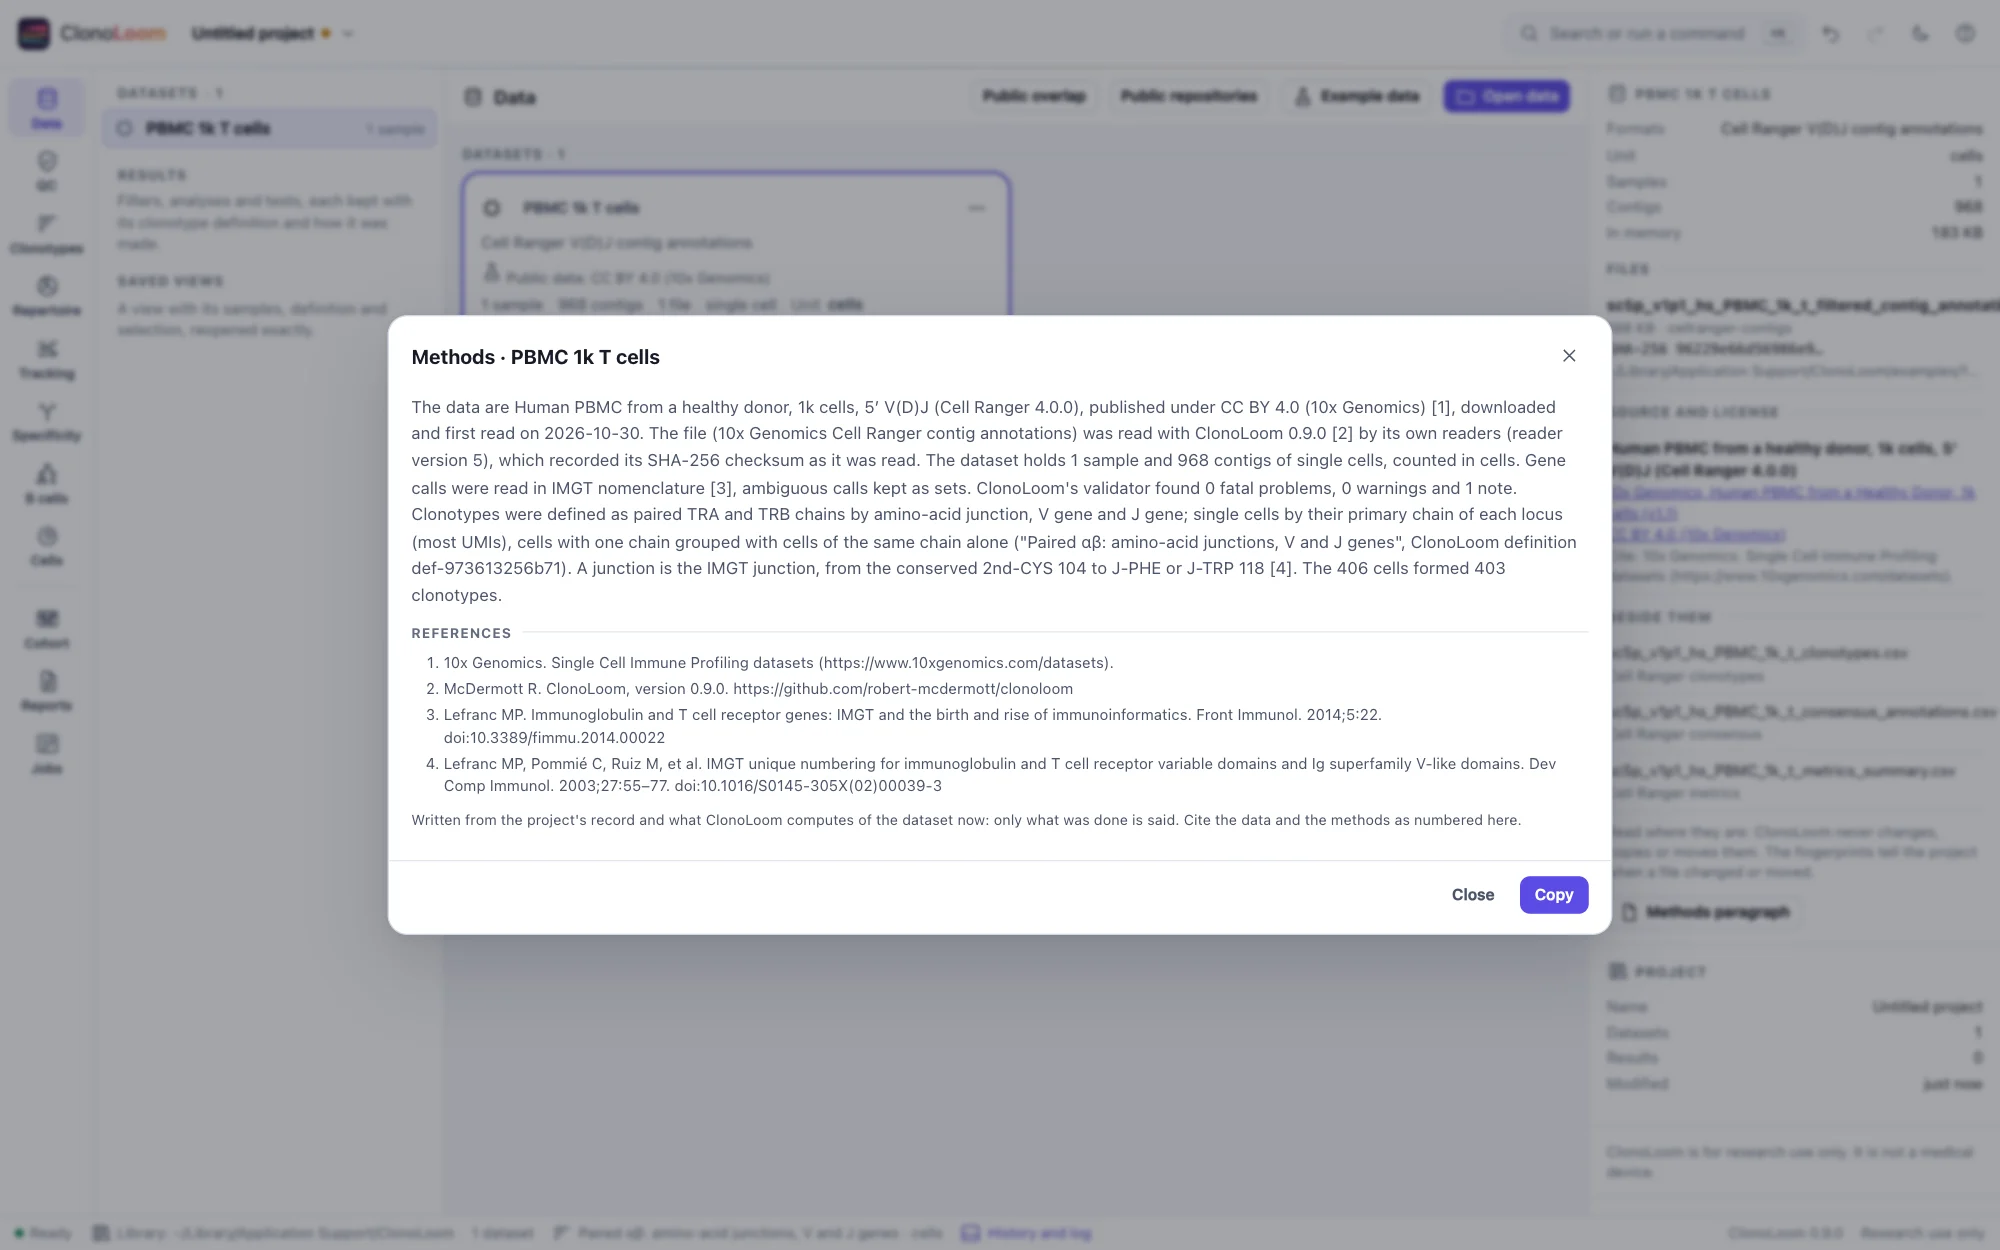
Every plot is saved as a figure whose caption states the clonotype definition, the unit and the samples. Rearrangements, clonotypes and results are exported with a notice of where they came from and under what license. A methods paragraph is written from the project's record, with numbered references, saying only what was done.

  • Figures as SVG, PNG at 300 dpi or PDF
  • AIRR Rearrangement TSV and CSV, each with its data's license and citation
  • Every release's project opened again, and its results made again, by the next
Figures and exports
A dataset's methods paragraph: the data's source and license, how ClonoLoom read and checked them, and the clonotype definition, with numbered referencesA dataset's methods paragraph: the data's source and license, how ClonoLoom read and checked them, and the clonotype definition, with numbered references
A methods paragraph, written from the record, with its references.
Validated

The same answers as the reference tools, and the truth

A validation suite checks each method against an independent implementation, the vendor's own numbers, or a simulated repertoire whose answers are known.

AreaChecked againstAgreement
ReadersEvery column of 35 AIRR, Cell Ranger, immunoSEQ, MiXCR, OAS, OTS and tcrdist3 files as the airr library 2.0.0 and pandas 3.1.0 read itevery value
Quality controlAn R implementation and iNEXT 3.0.2 on six bulk samples; Cell Ranger 4.0, 6.1 and 9.0's metrics for six runs; immunoSEQ's own clonalityto 10⁻¹²; exactly; to seven digits
Clonotypesscirpy 0.25.1 on eight Cell Ranger runs, by four definitionsthe same partitions of cells
DiversityiNEXT 3.0.2, immunarch and vegan 2.7.6 on 18 samplesthe measures seen to 10⁻⁹; the estimates to iNEXT's printed digits
Rarefaction and extrapolationiNEXT 3.0.2 at 40 sizes along each of 18 samples' curvesto 10⁻⁹ (the extrapolated Shannon diversity within 8 × 10⁻⁸)
Gene usageAn independent R implementation on 15 samples8,277 shares to 10⁻¹²
Overlapimmunarch, vegan and R on 69 pairs; scirpy 0.25.1 on four single-cell runsto 10⁻⁹; the same shared clonotypes
Tests over timeR's binom.test and fisher.test on 215 cases; an independent R implementation of the beta-binomial test and its fitto 4 × 10⁻¹²; the same fit
Tracking, classes and attributionSimulated CAR-T, transplant and null series whose truth is knownno false call where nothing changes; every class right; a donor's share within 0.065
TCRdisttcrdist3 0.3 on Dash et al. 2017's 2,339 epitope-specific clones, every pairevery distance
Generation probabilitiesOLGA 1.3.0 under its seven models on 99,949 CDR3s; the simulator's own frequenciesto 3 × 10⁻¹⁵
Neighborhoodstcrdist3 0.3's radii and enrichment on Dash et al.'s 415 human β chains against a weighted backgroundevery centroid
IntervalsSimulated repertoires whose truth is known: 200 samples of each, 330 pairsdiversity 91.5–99.5% where well sampled; usage 97.4–100%; overlap 95.2%
The simulator10x Genomics' 10k PBMC data's junction lengths and V usagemean length within 0.1 amino acids
B-cell workflowIndependent graph, sequence, exhaustive-tree and direct-count calculations on artificial truth36 families; 4,320 mutation rows; 72 trees; 2,160 cells in isotype summaries
ScaleA million rearrangements; a cohort of 100 samples; a million clonotypesread and checked in 1.6 s; reopened in 148 ms; a page in 38.5 ms

Methods, validation and citation

Releases

One wave at a time

Each release adds one part of the work, validated before it ships. The changelog has the details, and the roadmap what comes next.

ReleaseWhat it brought
0.1.0Trust the data: AIRR, Cell Ranger and immunoSEQ data read and checked, each sample's quality, clonotypes by an explicit definition, and a project that records where the data came from
0.2.0Repertoire basics: diversity, rarefaction and extrapolation, gene usage and junctions, and overlap, each with its uncertainty; figures, exports and other tools' tables; simulated studies and remote control
0.3.0Tracking: subjects and time points, clonotypes followed through a subject's samples, the clonotypes that expand or contract tested with false discoveries controlled (the beta-binomial test, its variance fitted on replicate samples), classes across time points, and attribution to an infusion product or a donor; the website
0.4.0Specificity: TCRdist and neighborhoods, generation probability, clonotype networks, matching to known epitopes, and invariant-population sequence rules
0.5.0B cells: AIRR and joined IMGT sequence evidence, thresholded clonal families, D-masked germlines, somatic hypermutation, bounded parsimony lineages and observed isotype usage; a complete artificial immunization guide
0.6.0Single cells: MEX, 10x HDF5, AnnData and MuData input; supplied and computed maps; clonotype phenotypes, modularity and receptor/expression neighborhoods; linked AnnData export and a complete artificial study
0.7.0Cohorts: saved subject designs, feature comparisons, replicated count models, definition robustness, exploratory motifs and HLA association, contamination and batch evidence, paired pseudobulk expression, and complete guided cohort studies
0.8.0Record and reach: exact certificates and replay, checkpoints, offline reports, portable archives, explicit automation, MCP, Python/R clients, typed exports and container jobs. Follow a complete record study.
0.9.0Suite and public data: exact AIRR metadata and objects, reporting completeness, native readers, reviewed ADC captures and observed overlap, Excel/Prism interchange, sibling links, bounded lineage likelihood and descriptive B-cell candidates. Follow the worked study and its limits.

Get started in a minute

Install with one command, then run clonoloom. It opens its own window, with public single-cell and bulk datasets and simulated studies ready to explore.

$ curl --proto '=https' --tlsv1.2 -fsSL https://raw.githubusercontent.com/robert-mcdermott/clonoloom/main/install.sh | sh
$ clonoloom