
Diversity
The Repertoire view measures each sample's diversity under the dataset's clonotype definition and filter, each measure with its 95% interval, and says when a sample is too incomplete for an estimate to be more than a lower bound.
Measure it
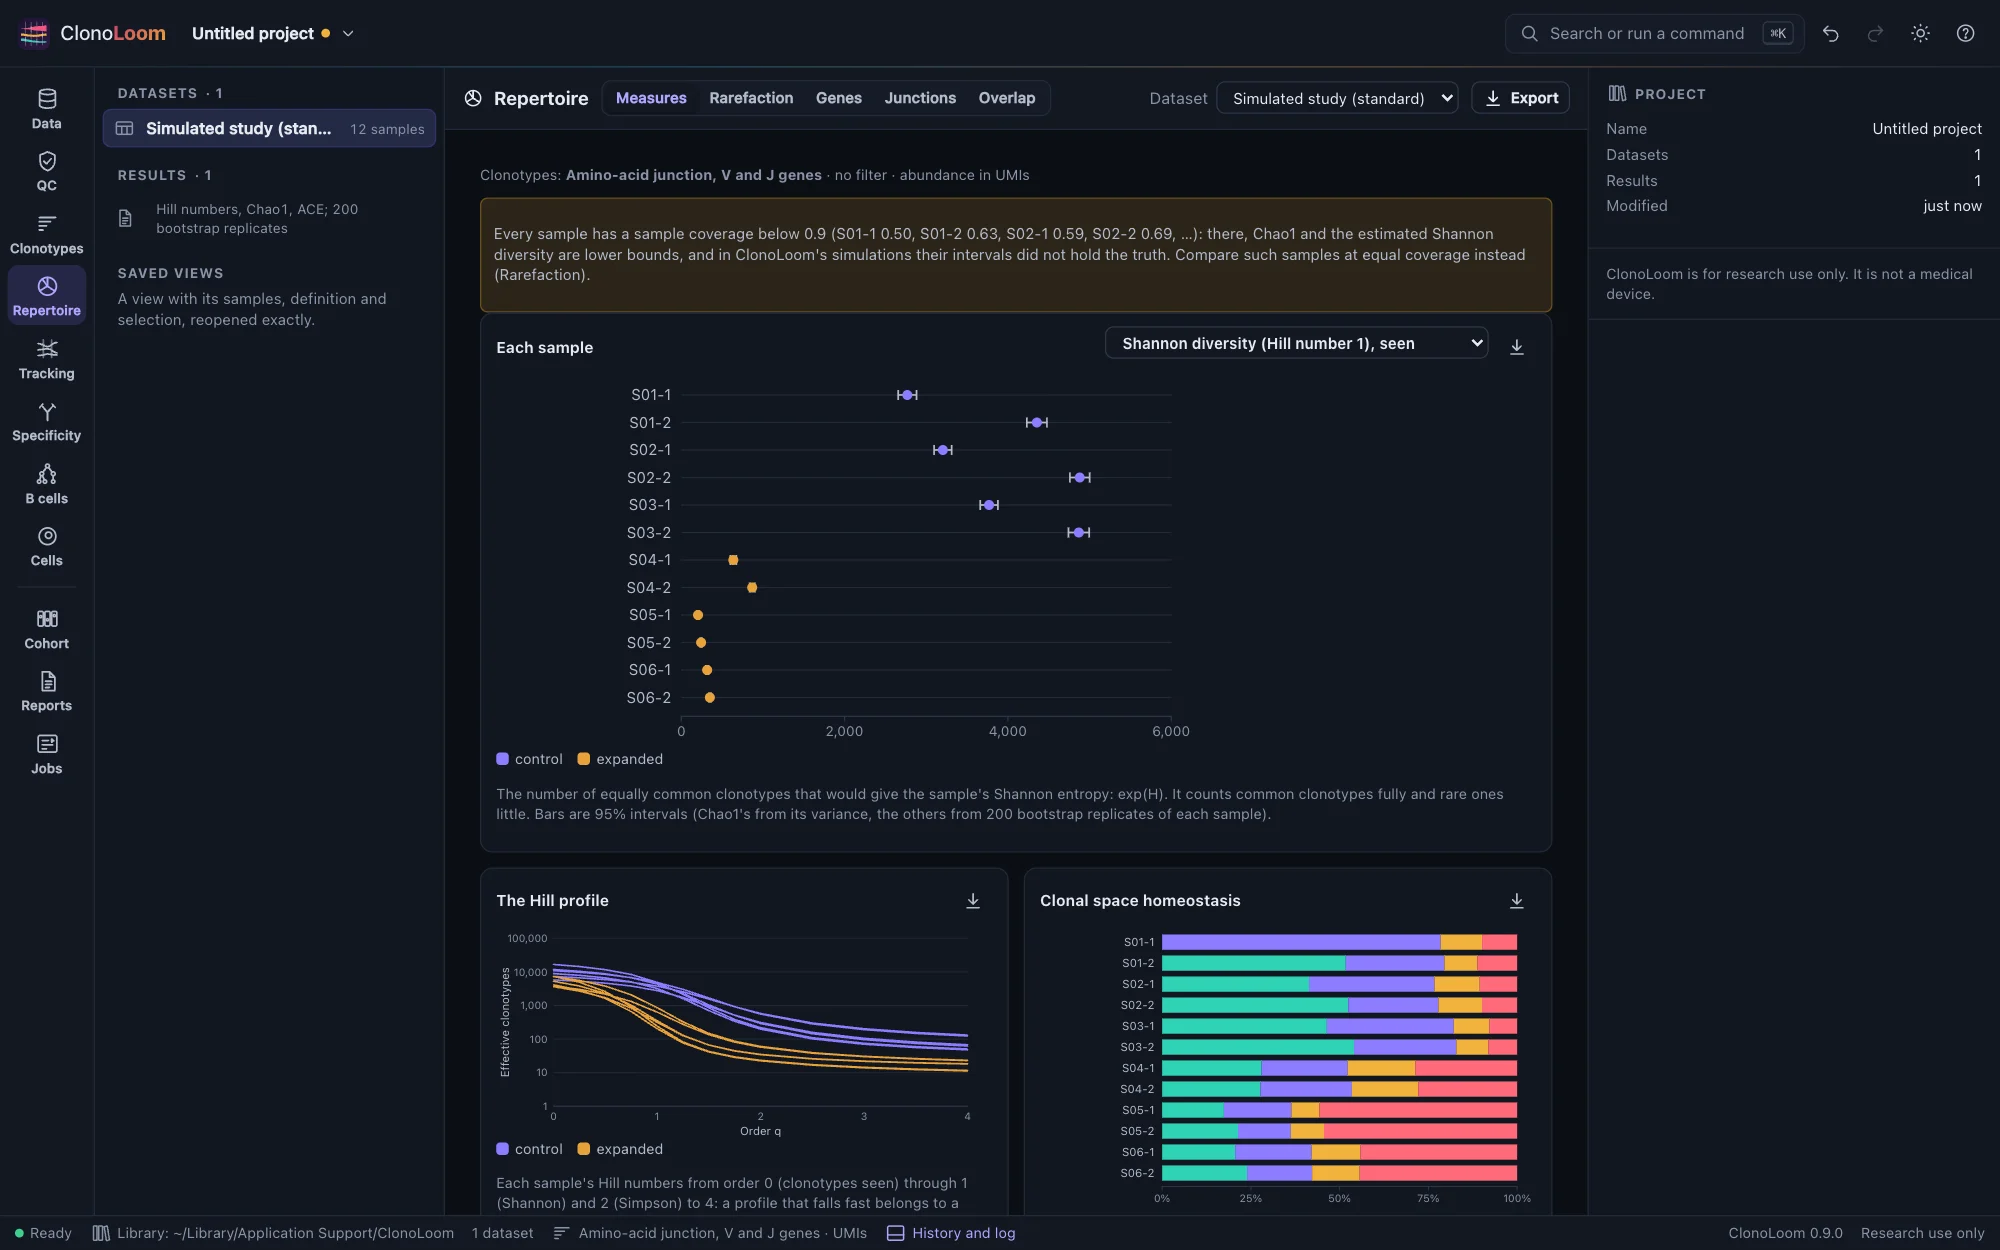
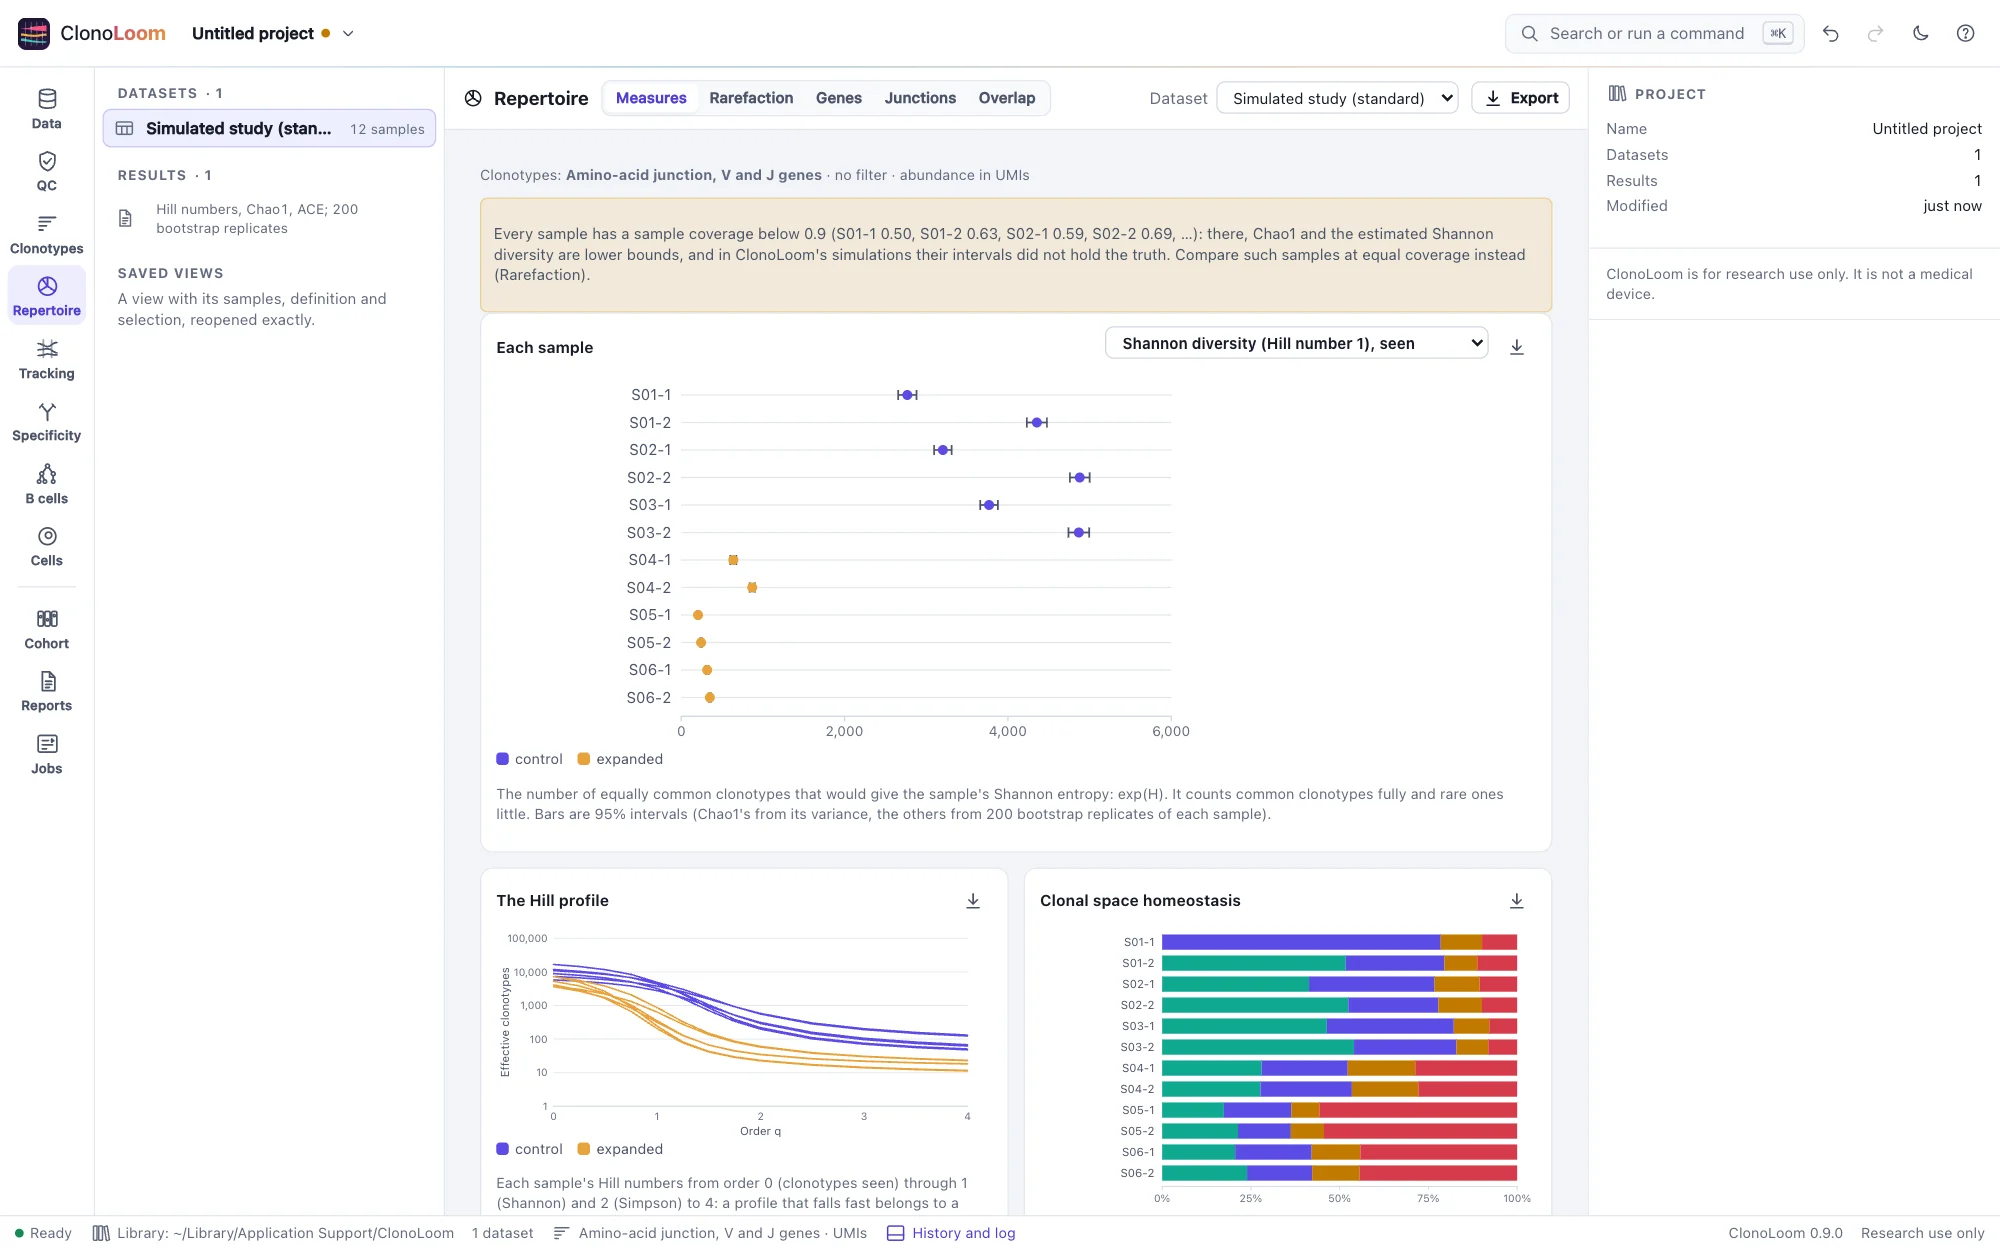
Open Repertoire and choose Measure diversity. It runs in the program as a job you can follow in Jobs, and the result is kept with the project: asked again with the same data, definition, filter and settings, the kept result answers at once.
The measures
- The Hill numbers (Hill 1973): the clonotypes seen (order 0), the Shannon diversity (order 1, the exponential of Shannon's entropy) and the Simpson diversity (order 2, the inverse of Simpson's index), and their profile up to order 4. Each is a number of equally common clonotypes, so they can be compared directly.
- Clonality (Adaptive's, 1 − Pielou's evenness) and Simpson clonality (√Σp²), evenness, Gini's coefficient, the 10, 100 and 1,000 largest clonotypes' shares, the largest frequency, and clonal space homeostasis: the share of the repertoire in rare, small, medium, large and hyperexpanded clonotypes.
- Estimates of the whole repertoire each sample was drawn from: its richness by Chao1 (bias-corrected) and ACE, its Shannon diversity (Chao, Wang and Jost 2013) and its Simpson diversity (Chao et al. 2014); and the sample coverage.
Choose a measure to see it across the samples, colored by condition; the table below lists every measure of every sample.
The intervals
Each interval is 95%. Chao1's comes from its variance, log-transformed; the others from 200 bootstrap replicates of each sample drawn from its estimated repertoire (Chao et al. 2014), the same on every run with the same seed. On simulated repertoires, how often the intervals held the truth is measured and stated on the Science page.
When a sample is incomplete
Read the coverage first. Where a sample's coverage is below about 0.9, Chao1 and the estimated Shannon diversity are lower bounds, not estimates: the repertoire's rare clonotypes have left too little trace. The view says so above the plots. To compare such samples, compare them at equal coverage (Rarefaction), not by their asymptotic estimates.
Diversity needs counts of cells or molecules. In reads, each cell is counted many times over, so few clonotypes are seen once and every sample looks complete; the view warns.
Using the result
Each plot's ⤓ button saves it as a figure; Export writes every measure of every sample as CSV; the methods paragraph says how diversity was measured, with its references (Figures and exports, The record). Scripts ask for it with measure_diversity (Remote control).