v0.8.1 FlowJo 11 and FACSDiva migration, an unmixing doctor, plates, dose-response and bead assays, kinetics, and headless runs

Flow cytometry analysis you can check

CytoWeave is an analysis workbench for conventional, spectral and mass cytometry, validated against known answers and the reference tools, that shows where every number comes from. It runs on your own computer as one self-contained program, installed with a single command: no license server, no account, no Python, R or plugins. Files are read and analyzed in your browser and never leave your machine.

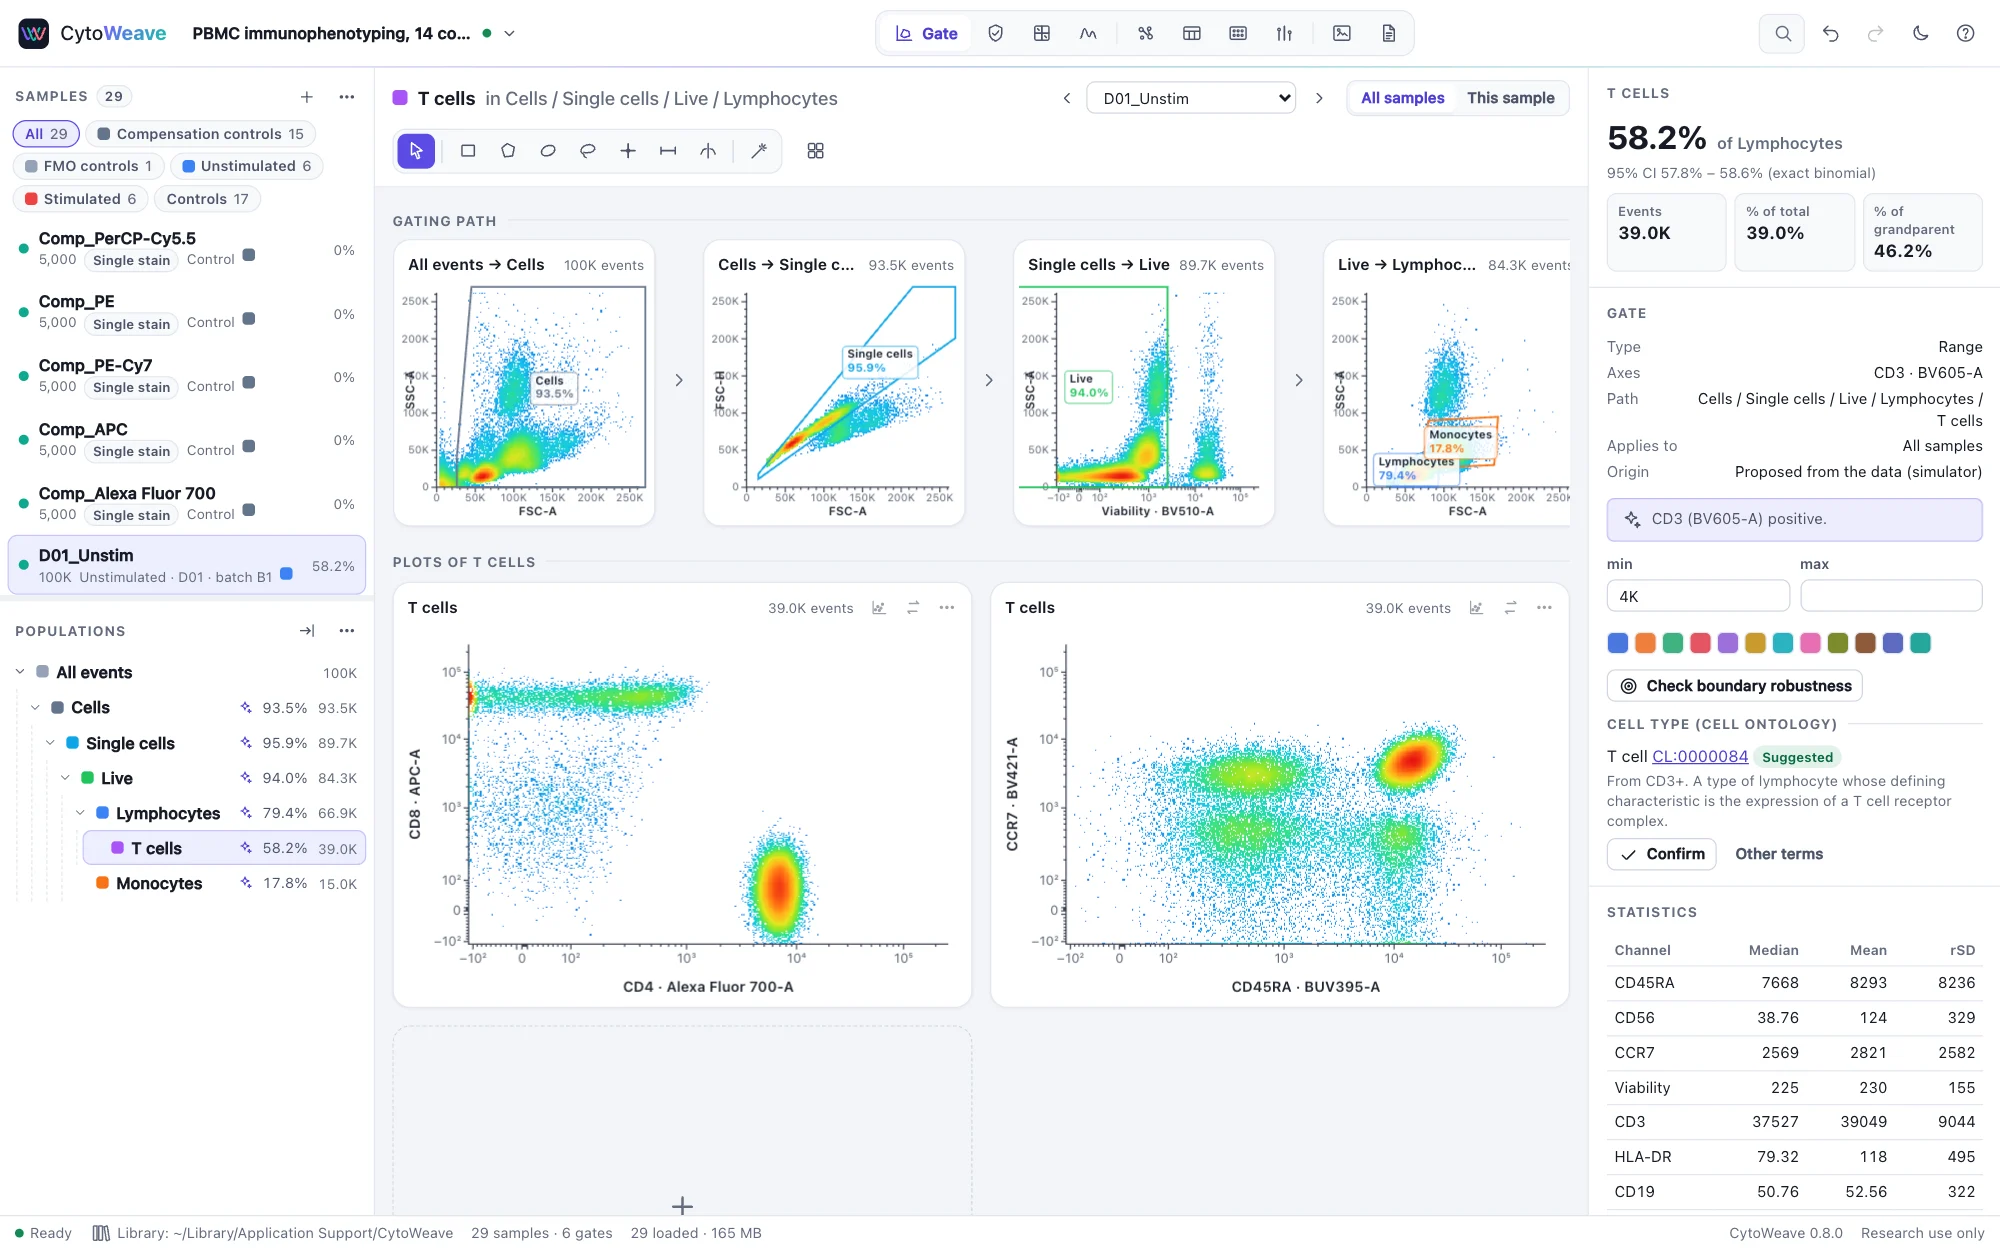
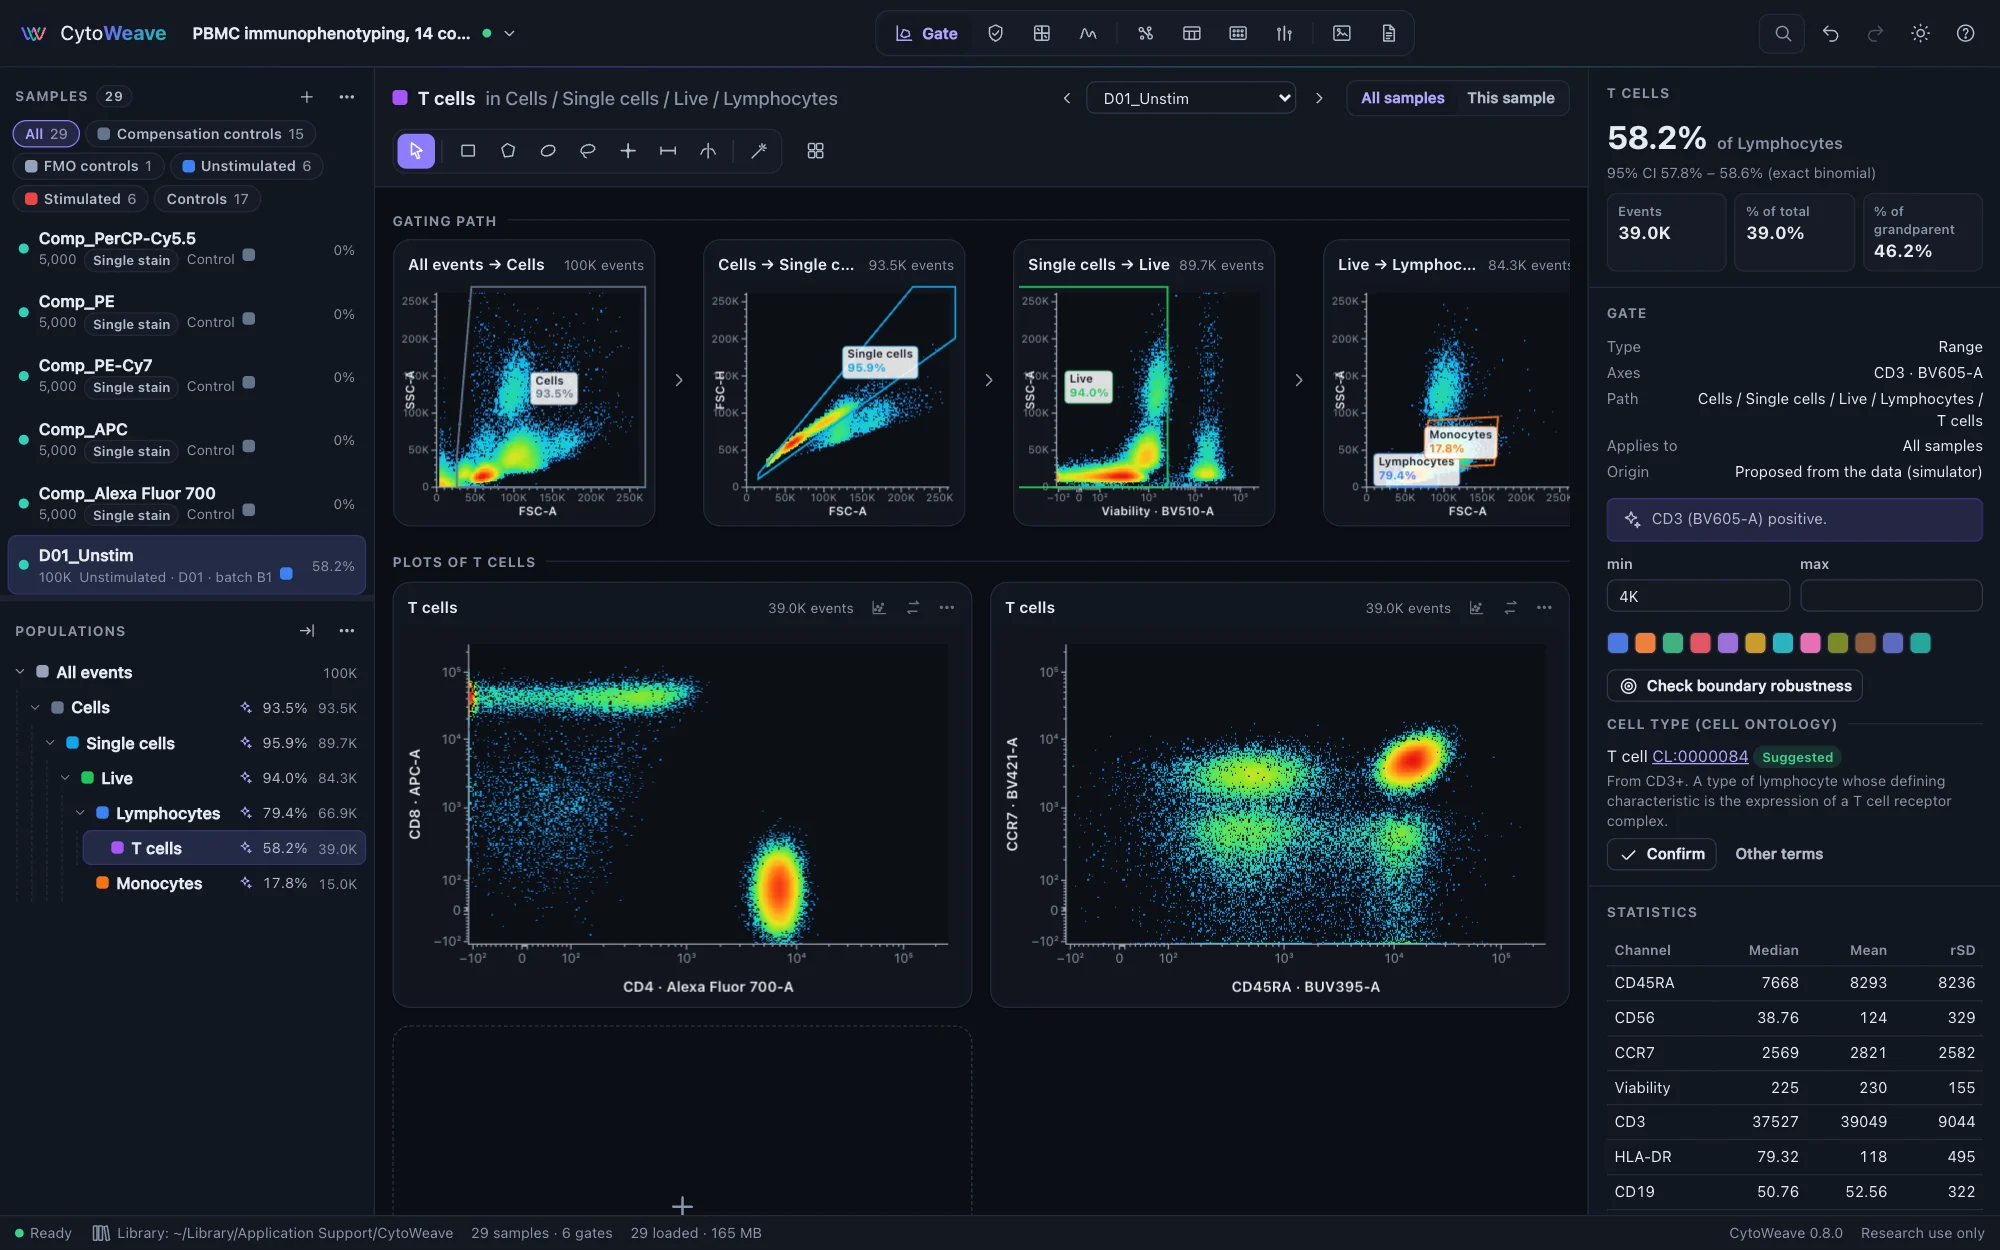
The Gate view of CytoWeave: the gating path of T cells in a 14-color PBMC experiment, with CD4 against CD8 and CD45RA against CCR7 plots, the population tree and the T-cell statisticsThe Gate view of CytoWeave: the gating path of T cells in a 14-color PBMC experiment, with CD4 against CD8 and CD45RA against CCR7 plots, the population tree and the T-cell statistics
The gating path of T cells in the bundled 14-color PBMC experiment, one of fourteen example experiments.
$ curl --proto '=https' --tlsv1.2 -fsSL https://raw.githubusercontent.com/robert-mcdermott/cytoweave/main/install.sh | sh

Installs the latest release in ~/.local/bin after checking its SHA-256 checksum, then prints how to start it. Other options

Free and open source (Apache 2.0) · macOS, Linux and Windows · x64 and ARM64

Private by design

FCS files are parsed and analyzed in your browser. Nothing is uploaded, and CytoWeave makes no network requests of its own.

Self-contained

One program for macOS, Linux and Windows, installed with one command. No license server, account, Python, R or plugins, and no administrator rights.

Checked at every step

Each step checks itself: the compensation against its controls, gates across samples, maps for faithfulness. The whole pipeline is validated against flowCore, FlowKit, PeacoQC, FlowSOM, CytoNorm and FlowJo.

Ready to publish

Live publication figures, a methods paragraph with references written from what you did, and a MIFlowCyt checklist.

What it does

The analysis loop of a cytometry lab, in one place

Compensate or unmix, clean the acquisition, gate the cohort consistently, explore it with clustering and maps, compare groups, and leave with figures and a methods paragraph.

Gating

Gate the whole cohort, adjust one sample

Draw rectangle, polygon, ellipse, freehand, quadrant, range and split gates, or let the magic wand take the density basin under the cursor. Gates are shared by every sample; adjusting one for a single sample makes a visible override, not a copy.

  • The gating path of any population as a row of plots
  • Logicle, arcsinh, log and FlowJo's biexponential, reproduced exactly
  • Backgating, overlays and Boolean populations
Gating
The Gate view: the gating path from all events to T cells, and T-cell plots of CD4 against CD8 and CD45RA against CCR7The Gate view: the gating path from all events to T cells, and T-cell plots of CD4 against CD8 and CD45RA against CCR7
T cells of donor D01, with their path through cells, singlets, live cells and lymphocytes.
Templates

Last month's analysis, or a published strategy, on today's data

Save an analysis as a template and apply it to the next experiment: its channels are matched by marker, not detector, so the panel can sit on other lasers, with a report of what matched and what could not be applied. The OMIP-101 and OMIP-090 gating strategies come built in, their gates placed on your own events and each explaining where it went and why.

  • Gates, scales, plots, tables and figures in one template
  • A Cell Ontology term suggested for every population, from its markers, never its name
  • Confirmed terms in FlowJo and Gating-ML exports, tables and the methods
Templates and cell types
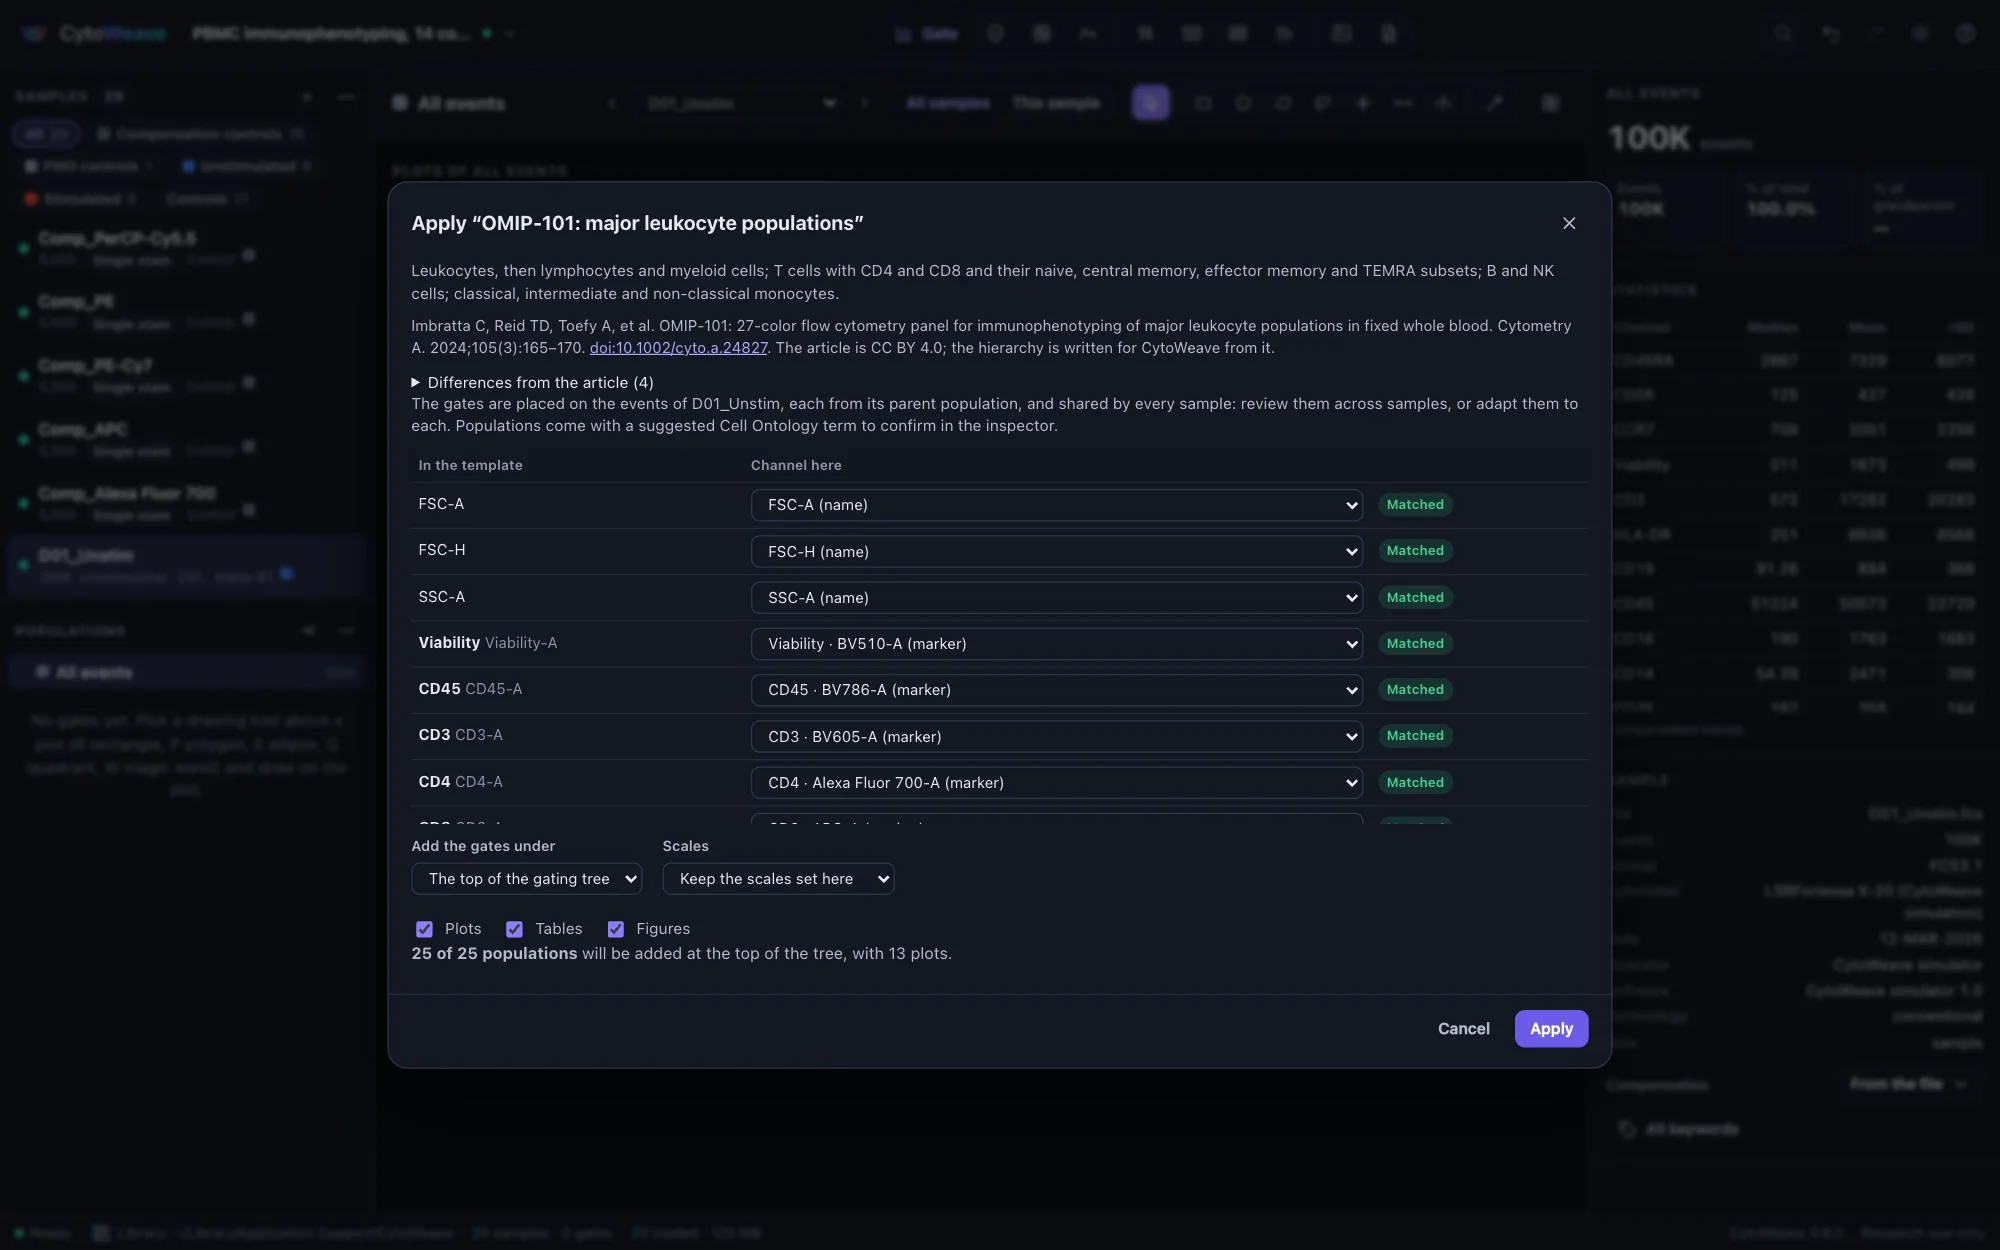
Applying OMIP-101 to the PBMC example: its citation, the differences from the article, every channel matched by marker, and 25 populations to be addedApplying OMIP-101 to the PBMC example: its citation, the differences from the article, every channel matched by marker, and 25 populations to be added
OMIP-101 applied to the PBMC example: every channel matched by marker, 25 gates to be placed on D01_Unstim's events.
Compensation

A spillover matrix checked against its controls

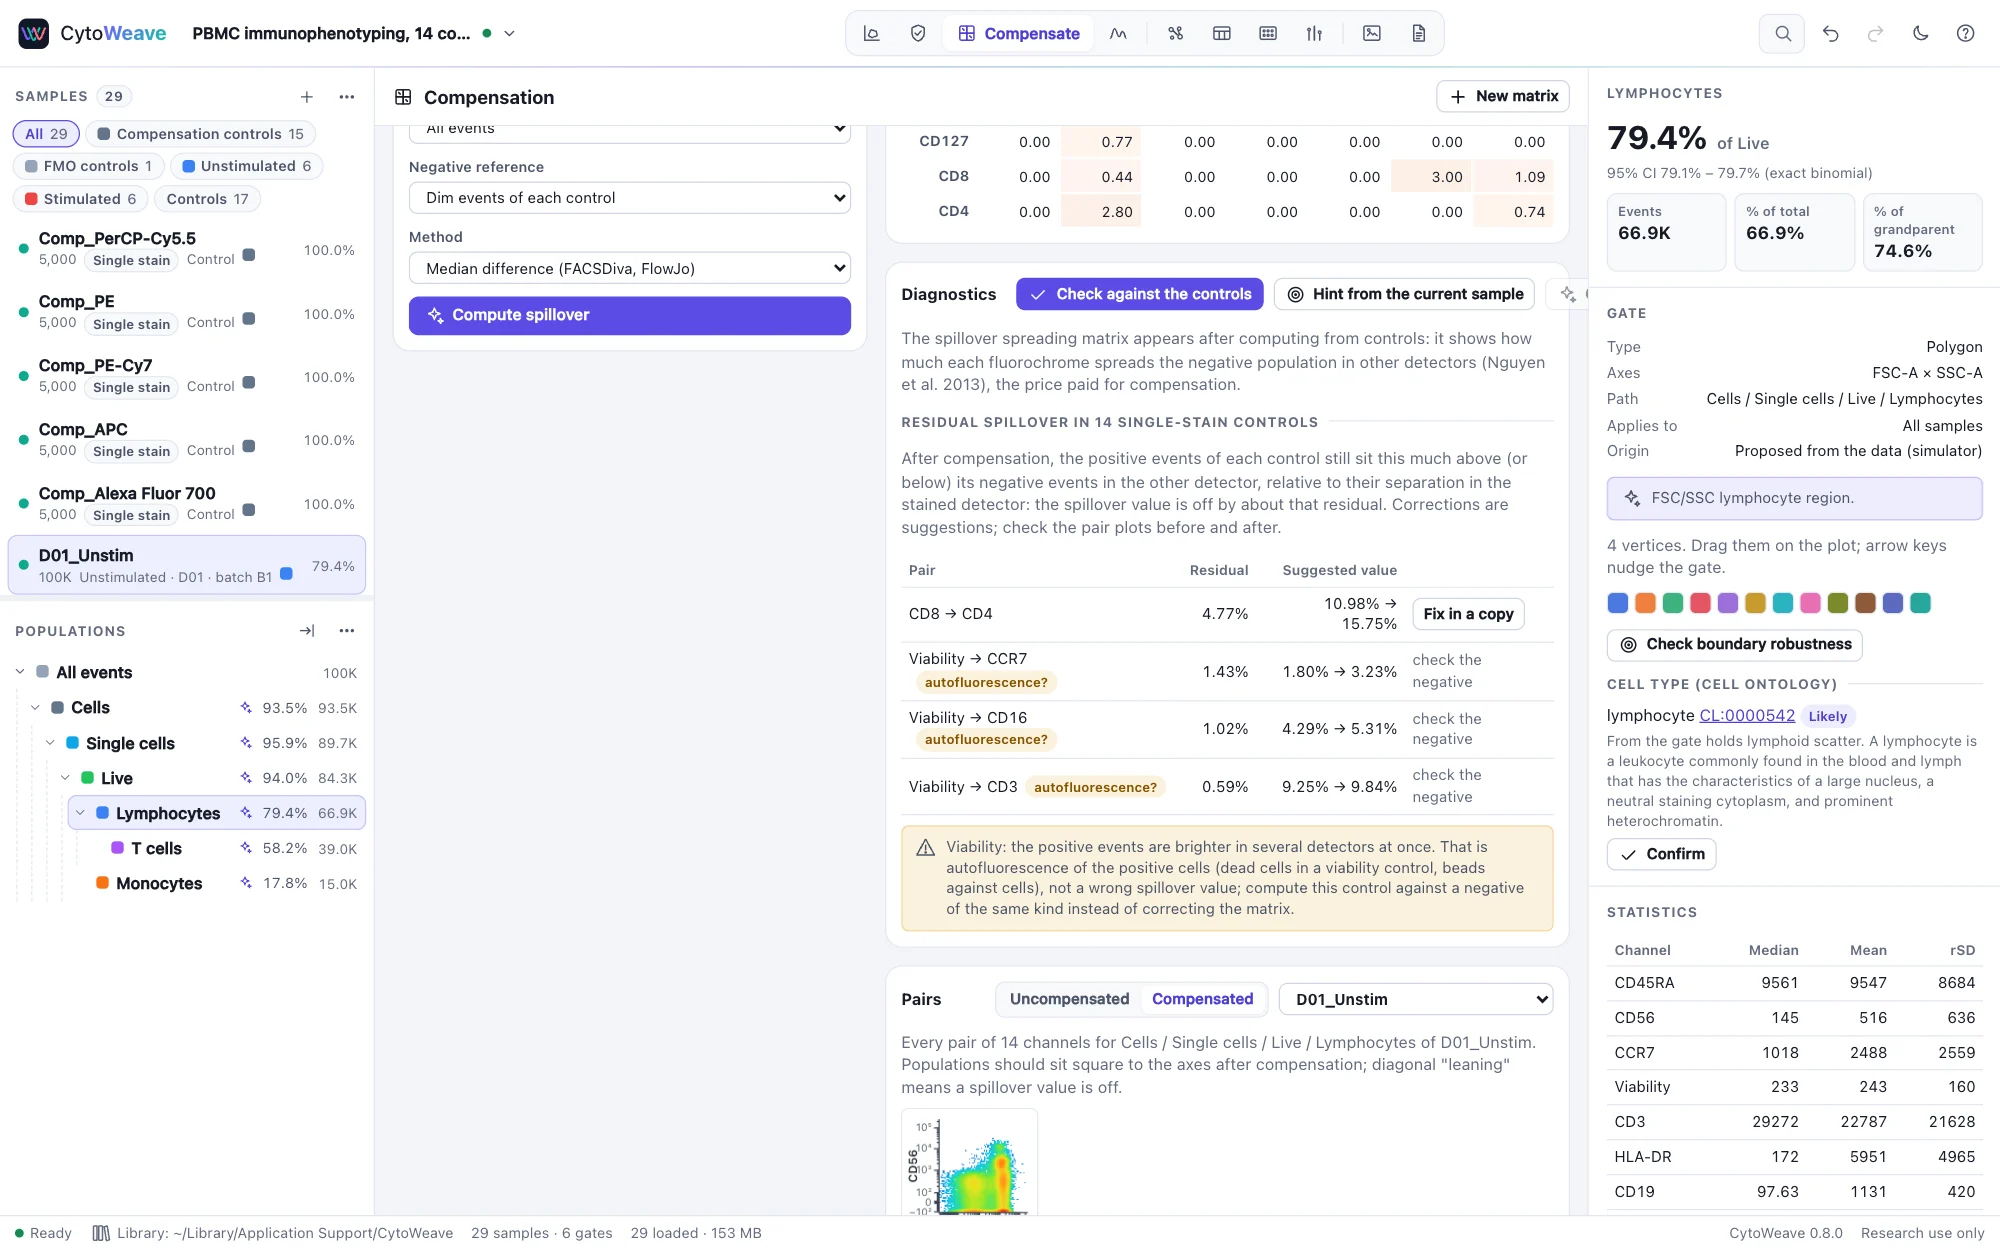
Compute spillover from single-stain controls by median difference or robust regression, or bring the file's matrix. Then check it: each control is compensated and what its positives still leave in other detectors is measured. A residual means the value is off by about that much, and CytoWeave suggests the correction.

  • Autofluorescent positives, such as dead cells, recognized as such
  • The spillover spreading matrix and N×N pair plots
  • Corrections in one undoable step
Compensation
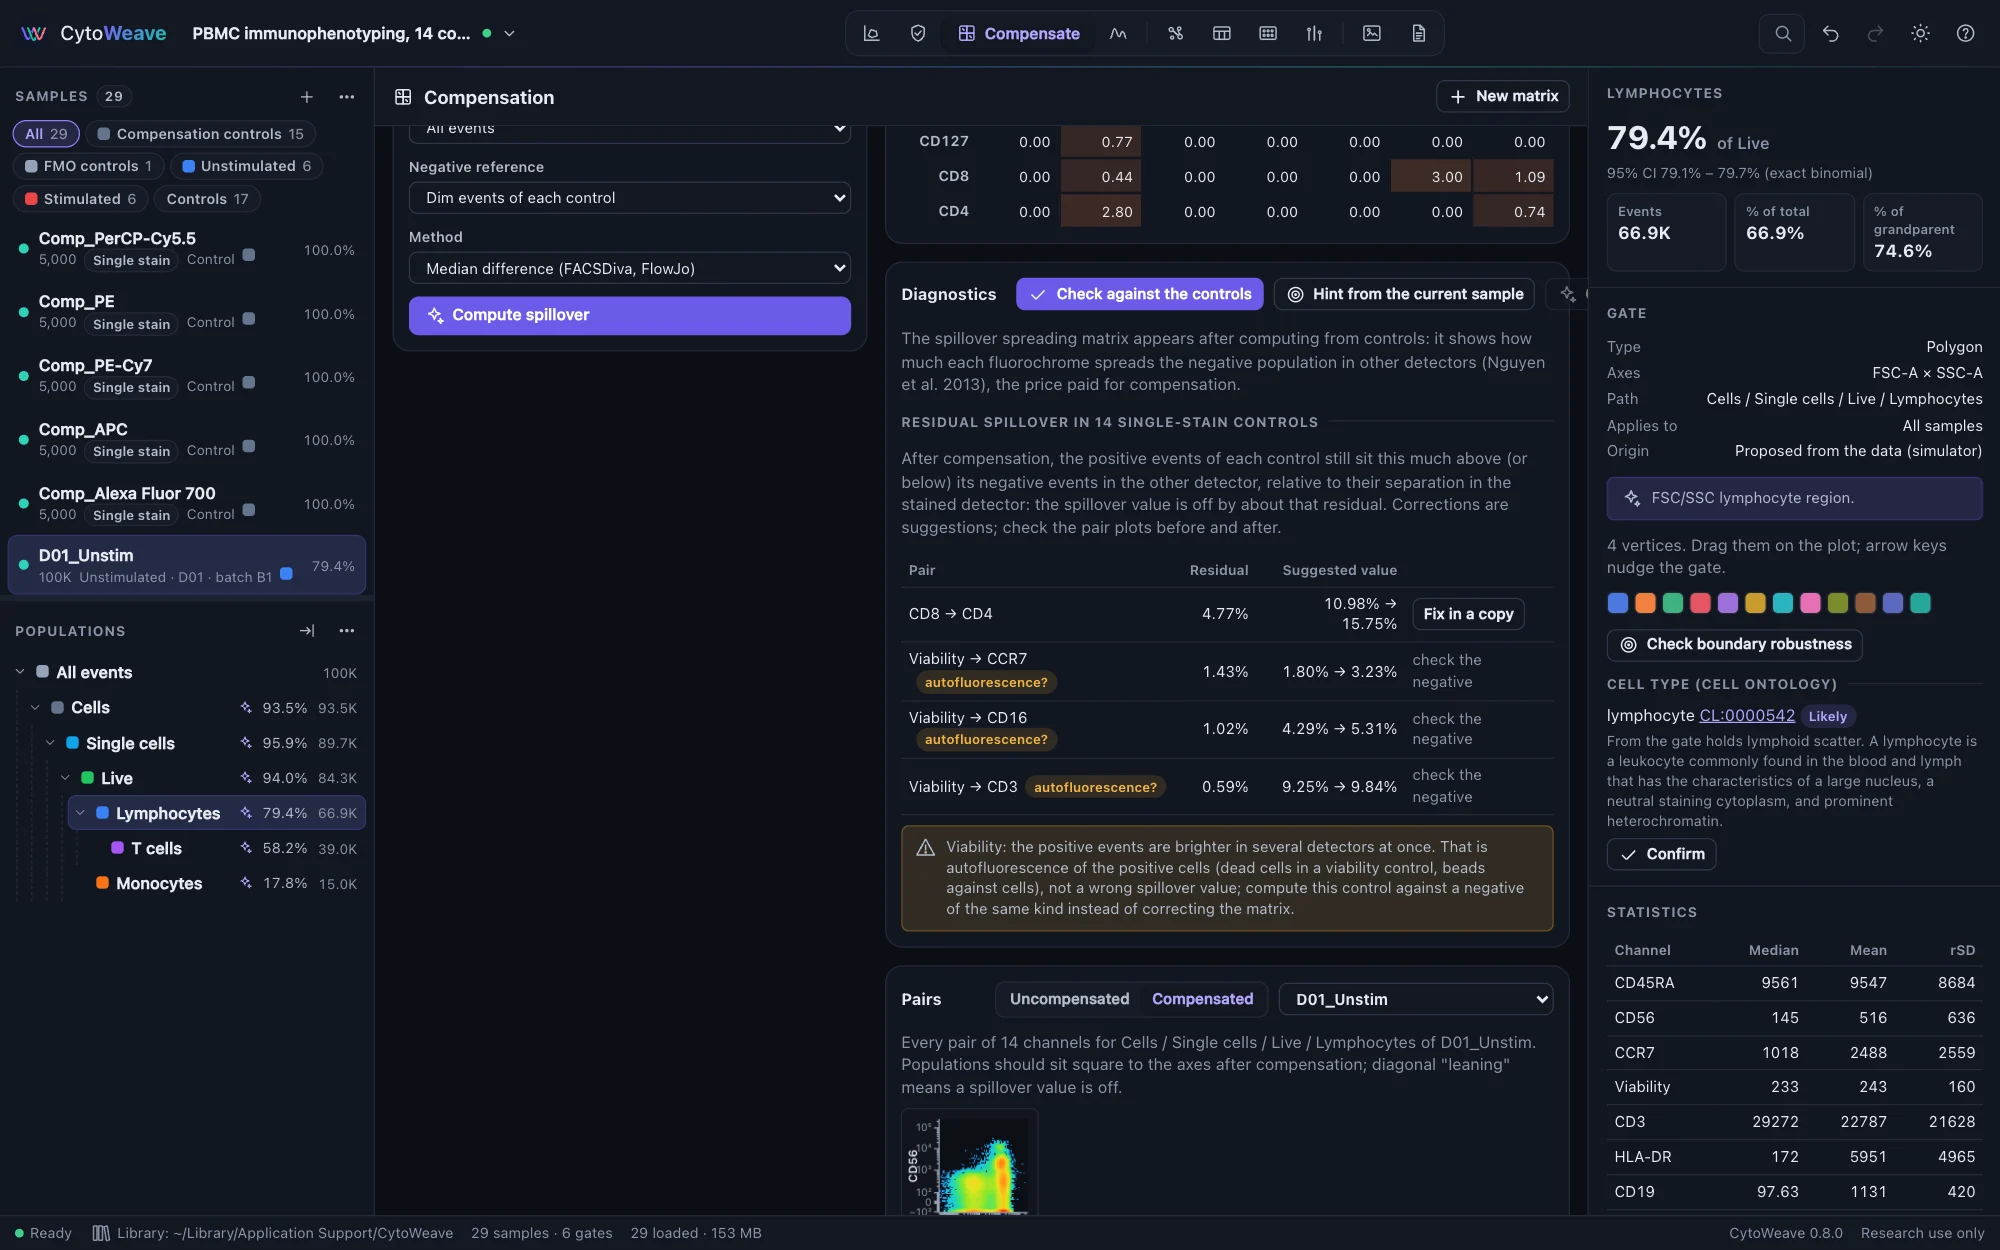
The compensation check of the PBMC example: CD8 into CD4 has a residual of 4.77%, with a suggested value of 15.75%, and the viability control is flagged as autofluorescenceThe compensation check of the PBMC example: CD8 into CD4 has a residual of 4.77%, with a suggested value of 15.75%, and the viability control is flagged as autofluorescence
The PBMC example's file matrix has one wrong value, APC into Alexa Fluor 700; the check finds it and suggests 15.75%.
Spectral

Unmixing, and the evidence to choose a model

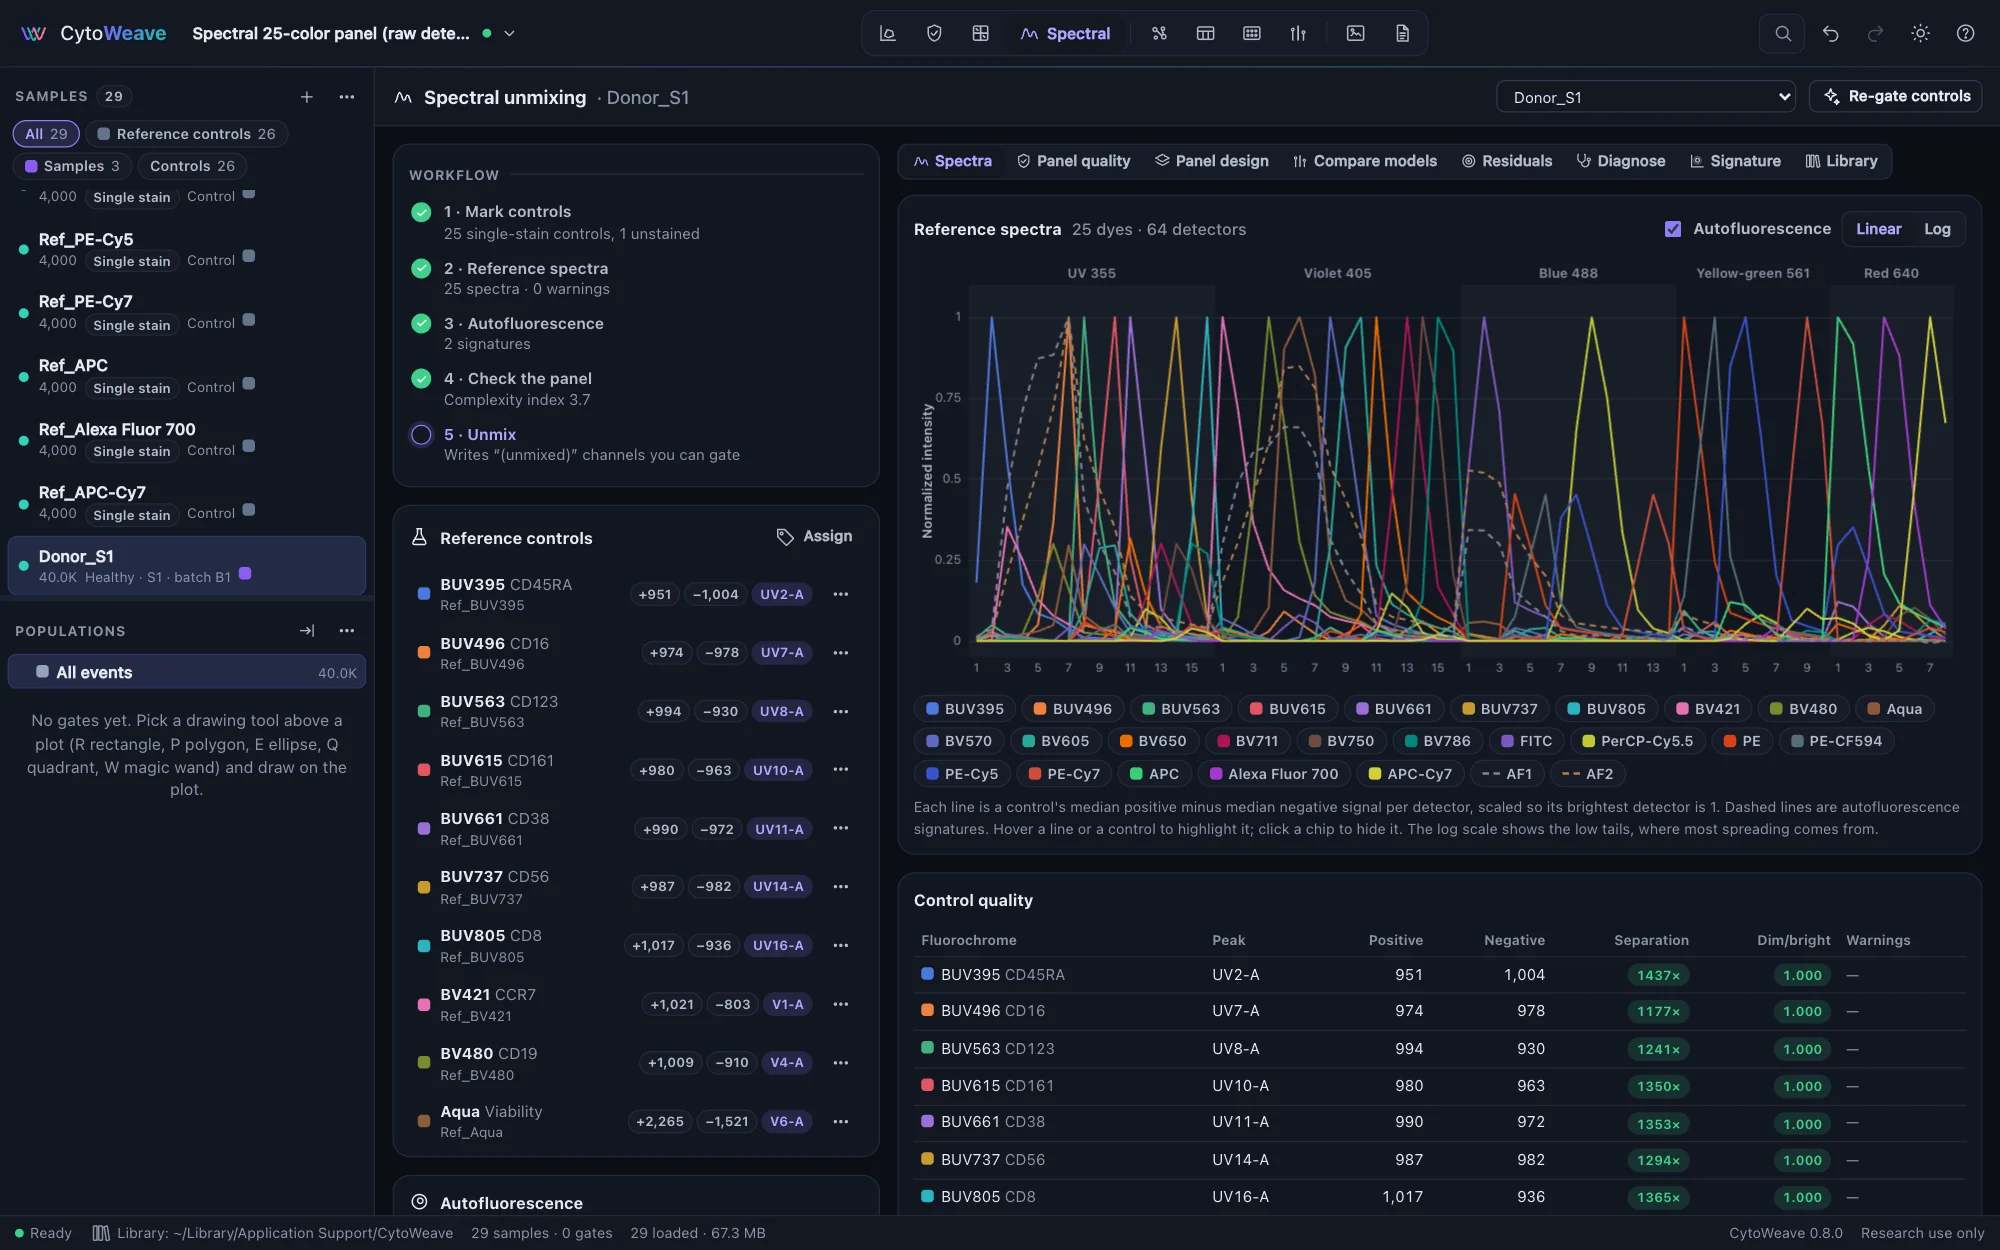
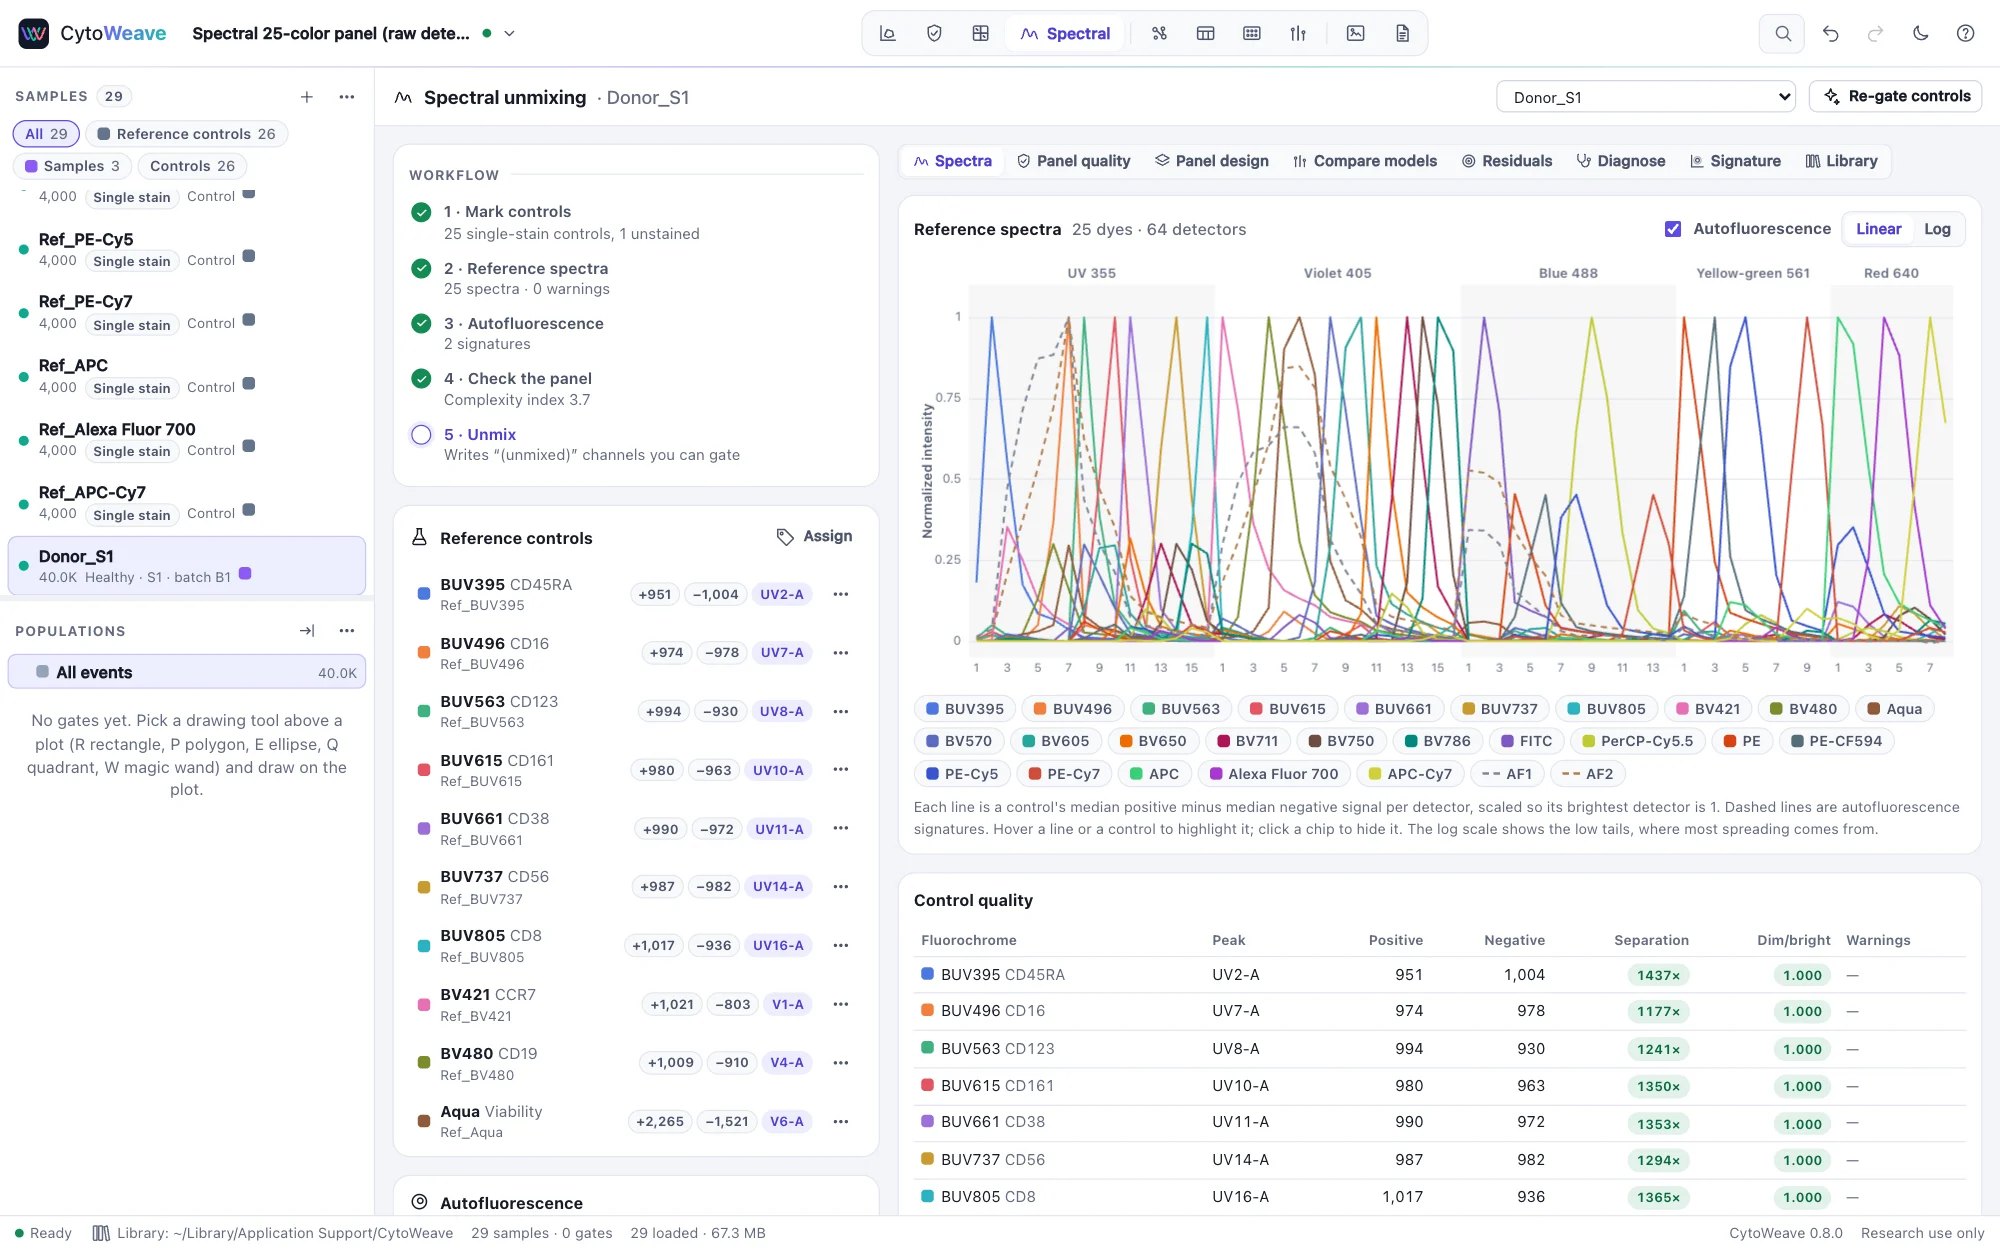
Reference spectra are gated from the single-stain controls automatically, and several autofluorescence signatures are extracted from the unstained control. Unmix by ordinary, weighted or non-negative least squares, with per-event autofluorescence.

  • Complexity index, similarity and spreading matrices
  • Seven unmixing models compared on your own sample
  • A residual channel that shows what the references miss
Spectral unmixing
The Spectral view: 25 reference spectra across 64 detectors with autofluorescence signatures from the unstained controlThe Spectral view: 25 reference spectra across 64 detectors with autofluorescence signatures from the unstained control
A 25-color panel on 64 detectors: references from the controls, autofluorescence from the unstained sample.
Unmixing doctor

Why an unmixing looks wrong, and the fix, tried on your sample

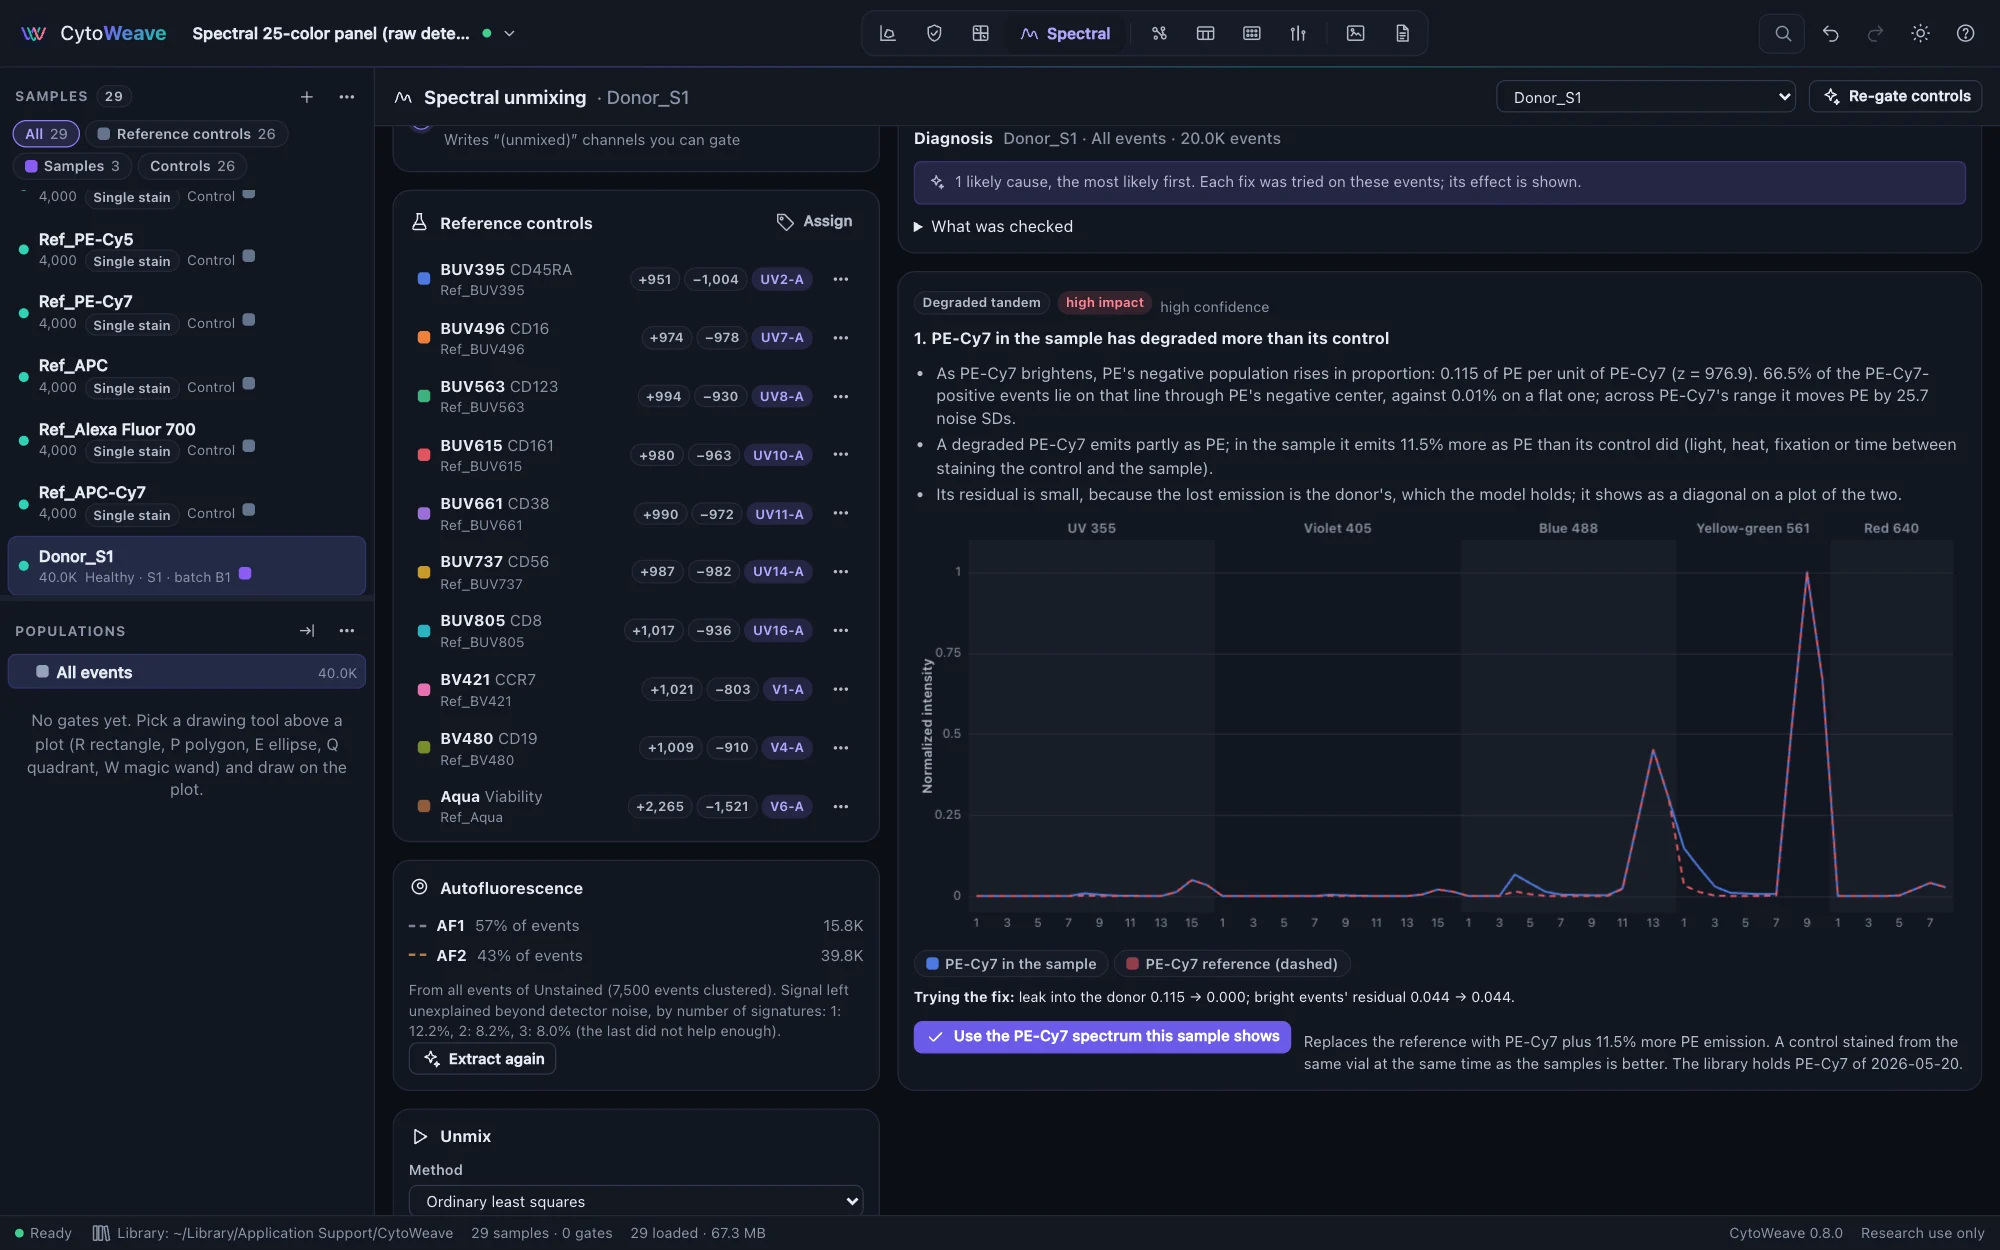
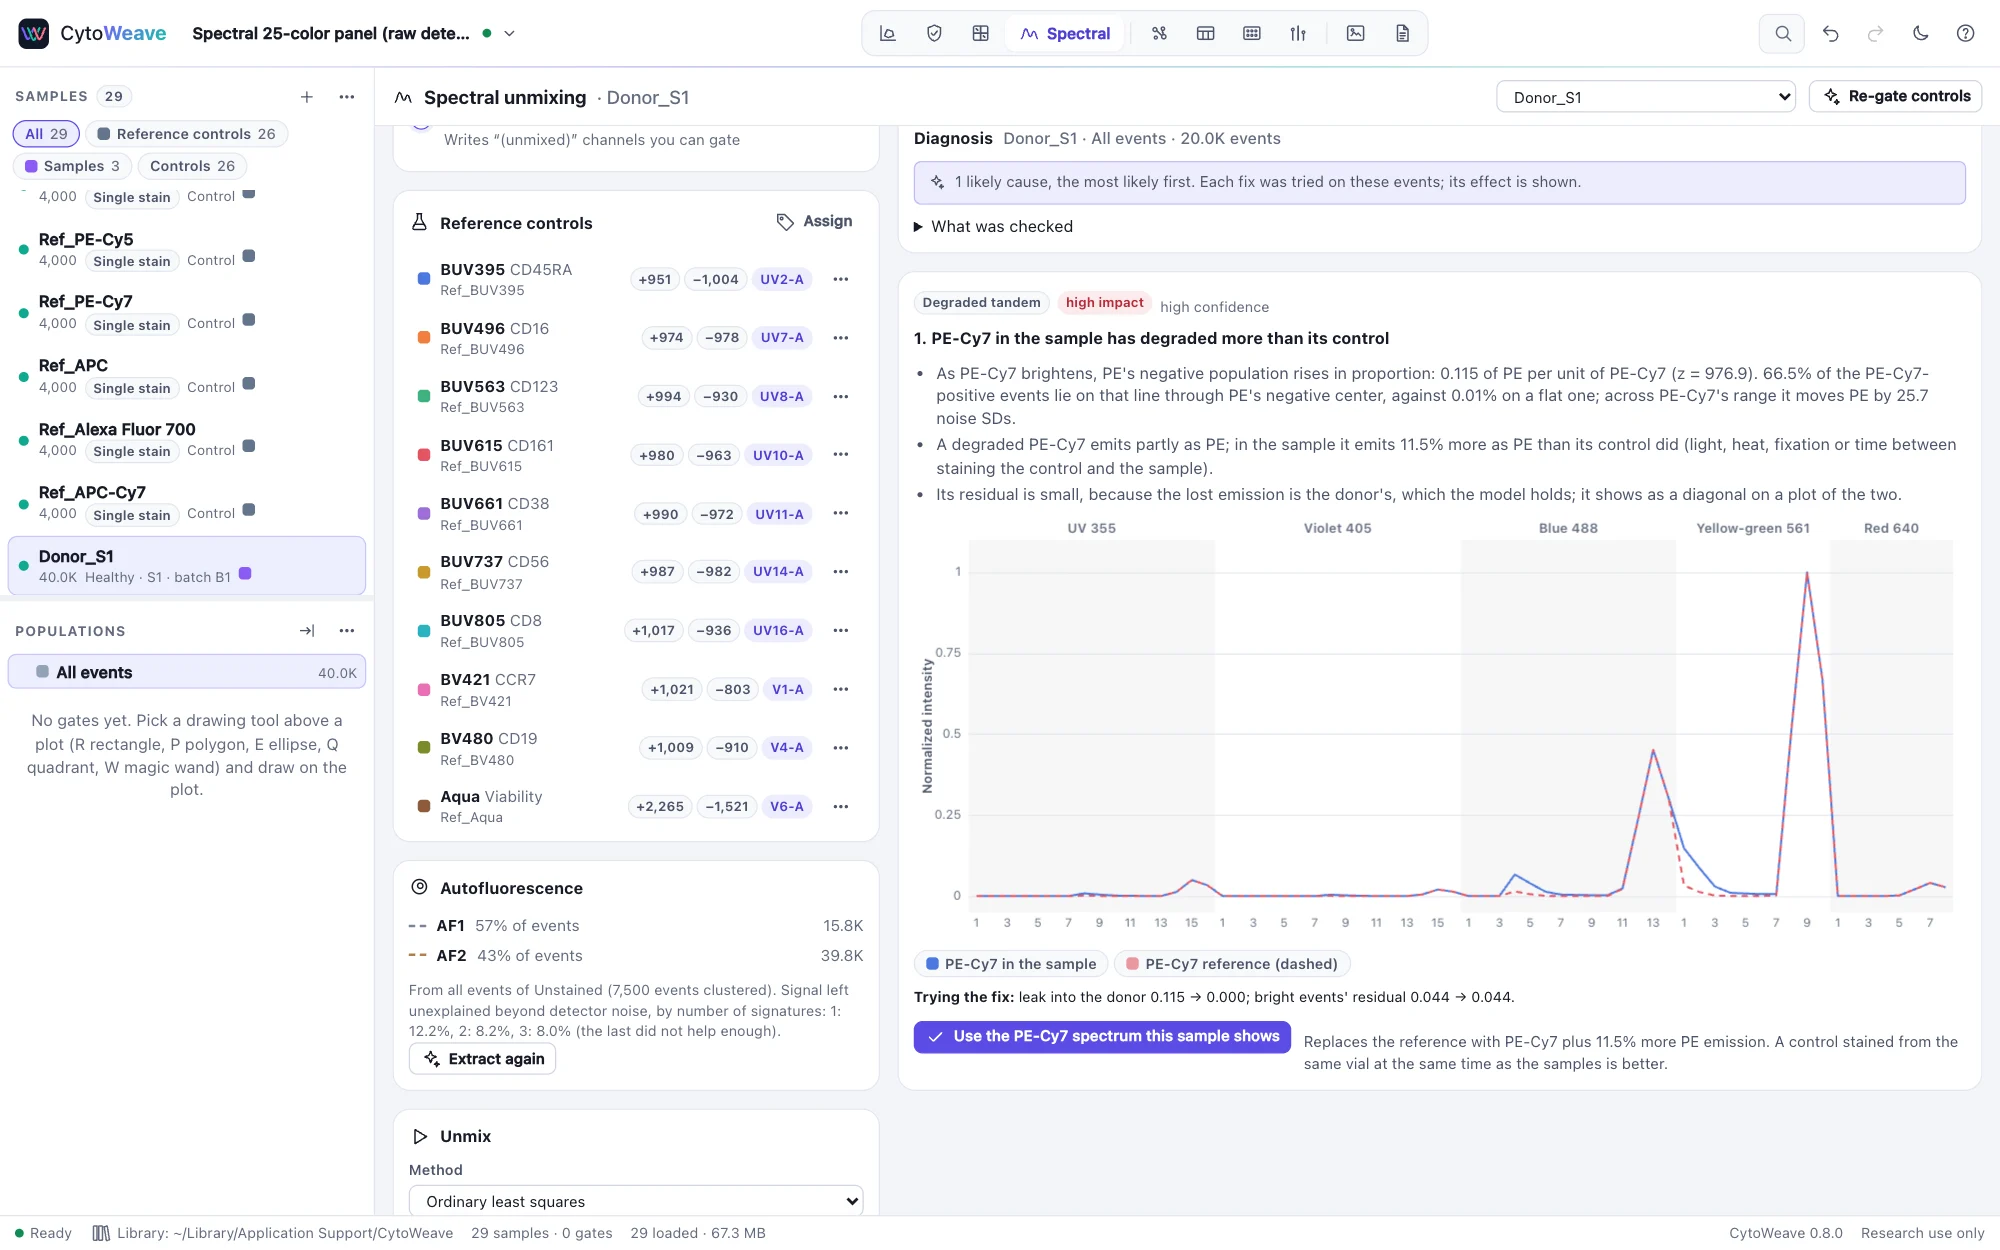
When unmixed populations spread or lean, the doctor names the likely cause from the residuals, the controls and the spectral library: a dye without a reference, a control that holds another dye or behaves differently on beads, a tandem degraded in the sample or its control, or autofluorescence the unstained control does not have. Each fix is tried on the same events and its effect shown before you apply it.

  • Each planted fault named first on simulated experiments, nothing on clean ones
  • Autofluorescent cell controls and a fixed tissue found on real controls
  • A fix applied to the reference library in one undoable step
Diagnosing a poor unmixing
The unmixing doctor: PE-Cy7 in the sample has degraded more than its control, with the evidence, the sample's PE-Cy7 spectrum against the reference, and the fix tried on the same eventsThe unmixing doctor: PE-Cy7 in the sample has degraded more than its control, with the evidence, the sample's PE-Cy7 spectrum against the reference, and the fix tried on the same events
A tandem degraded in the sample: PE-Cy7 emits 11.5% more as PE than its control did.
Acquisition QC

Find clogs and bubbles, leave clean data alone

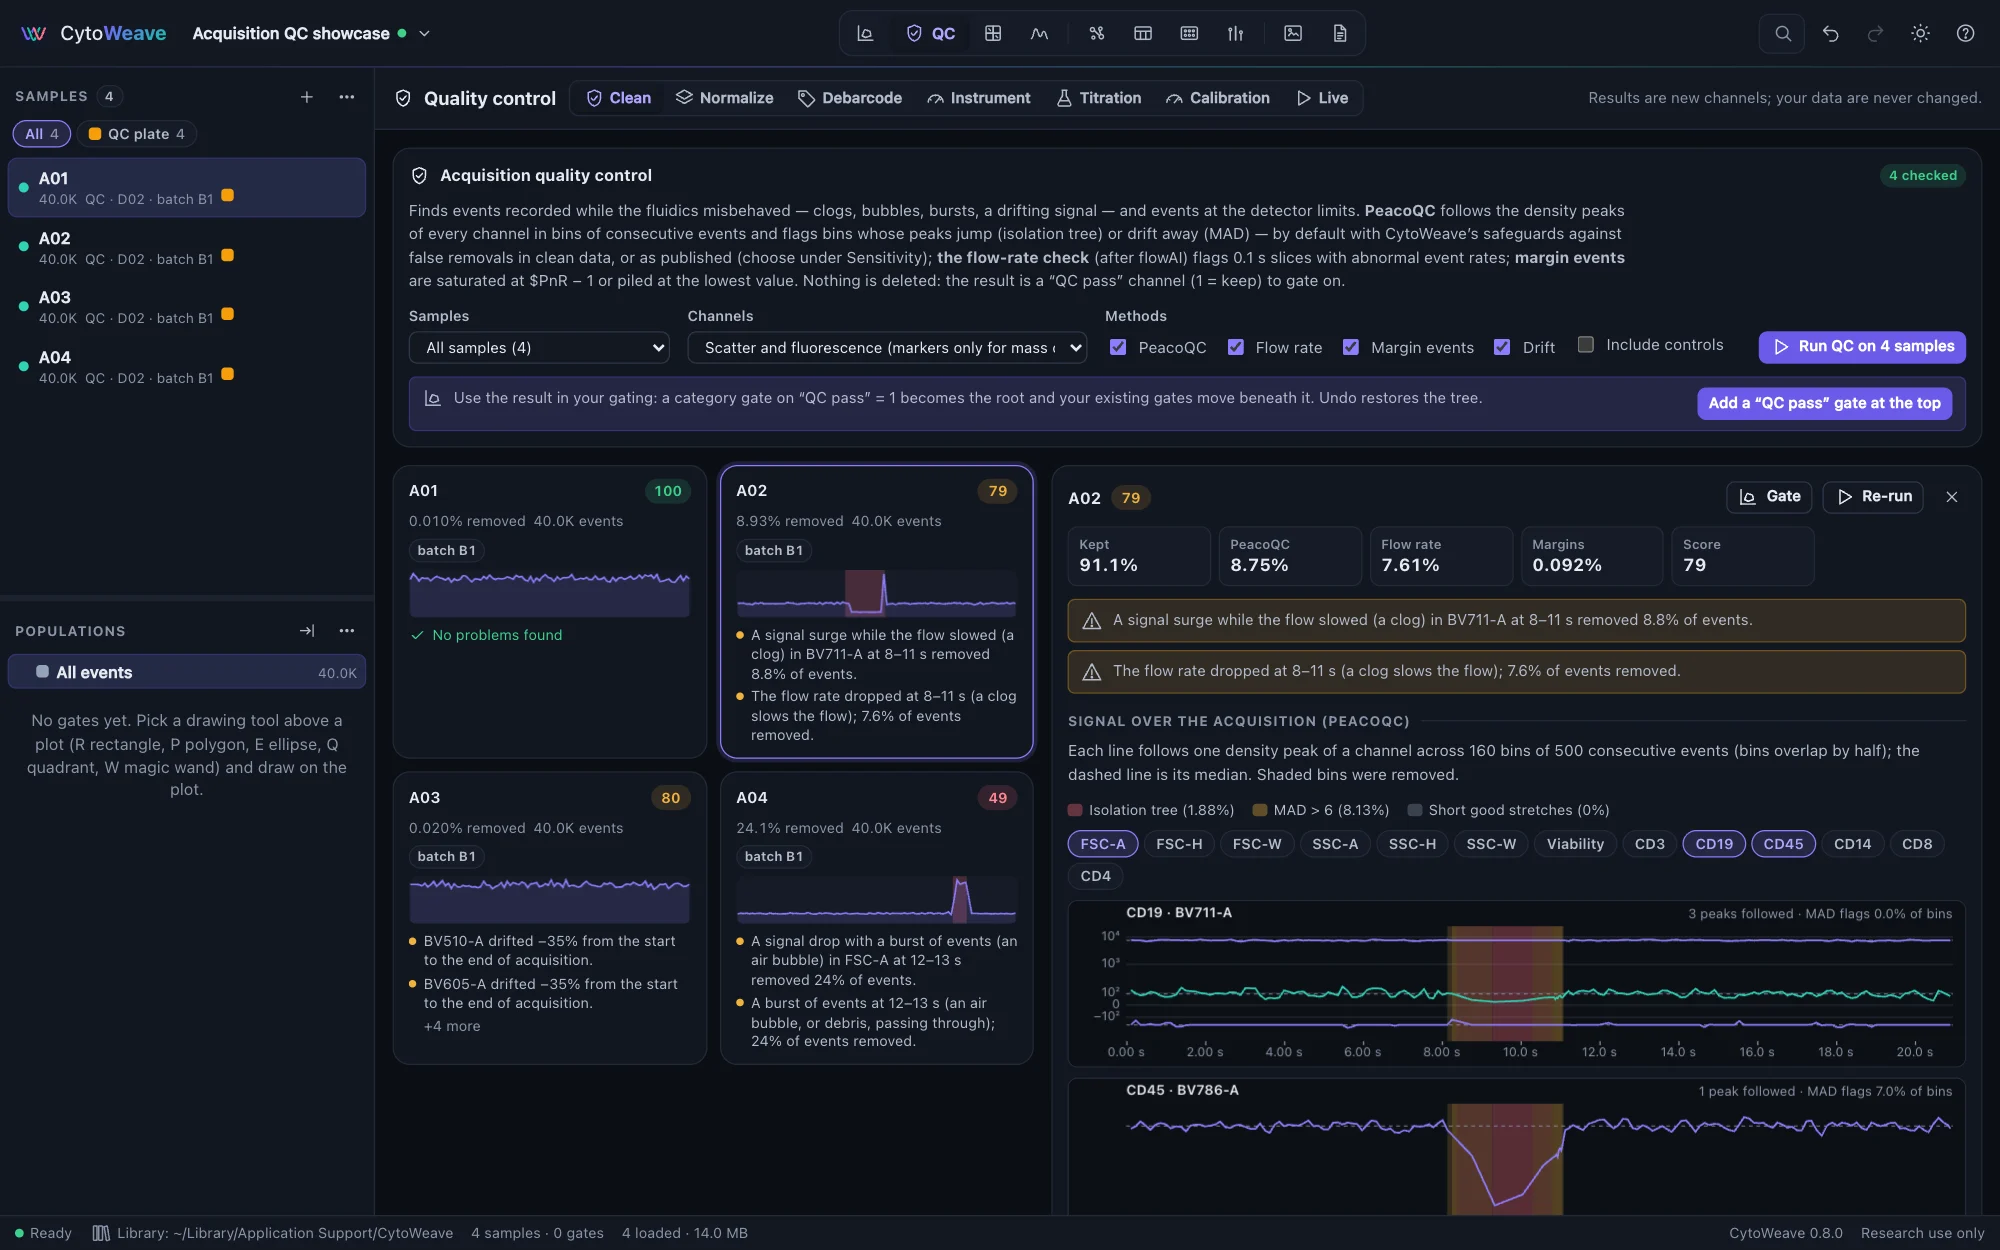
PeacoQC, a flow-rate check, margin events and per-channel drift, with a 0–100 score per sample and plain-language findings. CytoWeave's refined PeacoQC stops the published algorithm removing events from clean or slowly drifting files; the classic port is one click away.

  • A "QC pass" channel to gate on; your data are never changed
  • A cohort overview of every sample
  • The classic algorithm removes the same events as PeacoQC in R
Acquisition QC
The QC view of a four-well plate: a clean well scored 100, a signal surge with a flow-rate drop, a drift and a burst, with the PeacoQC traces of the second wellThe QC view of a four-well plate: a clean well scored 100, a signal surge with a flow-rate drop, a drift and a burst, with the PeacoQC traces of the second well
Four wells: clean, a clog, gradual drift and a burst. Only the anomalies are removed.
Instrument

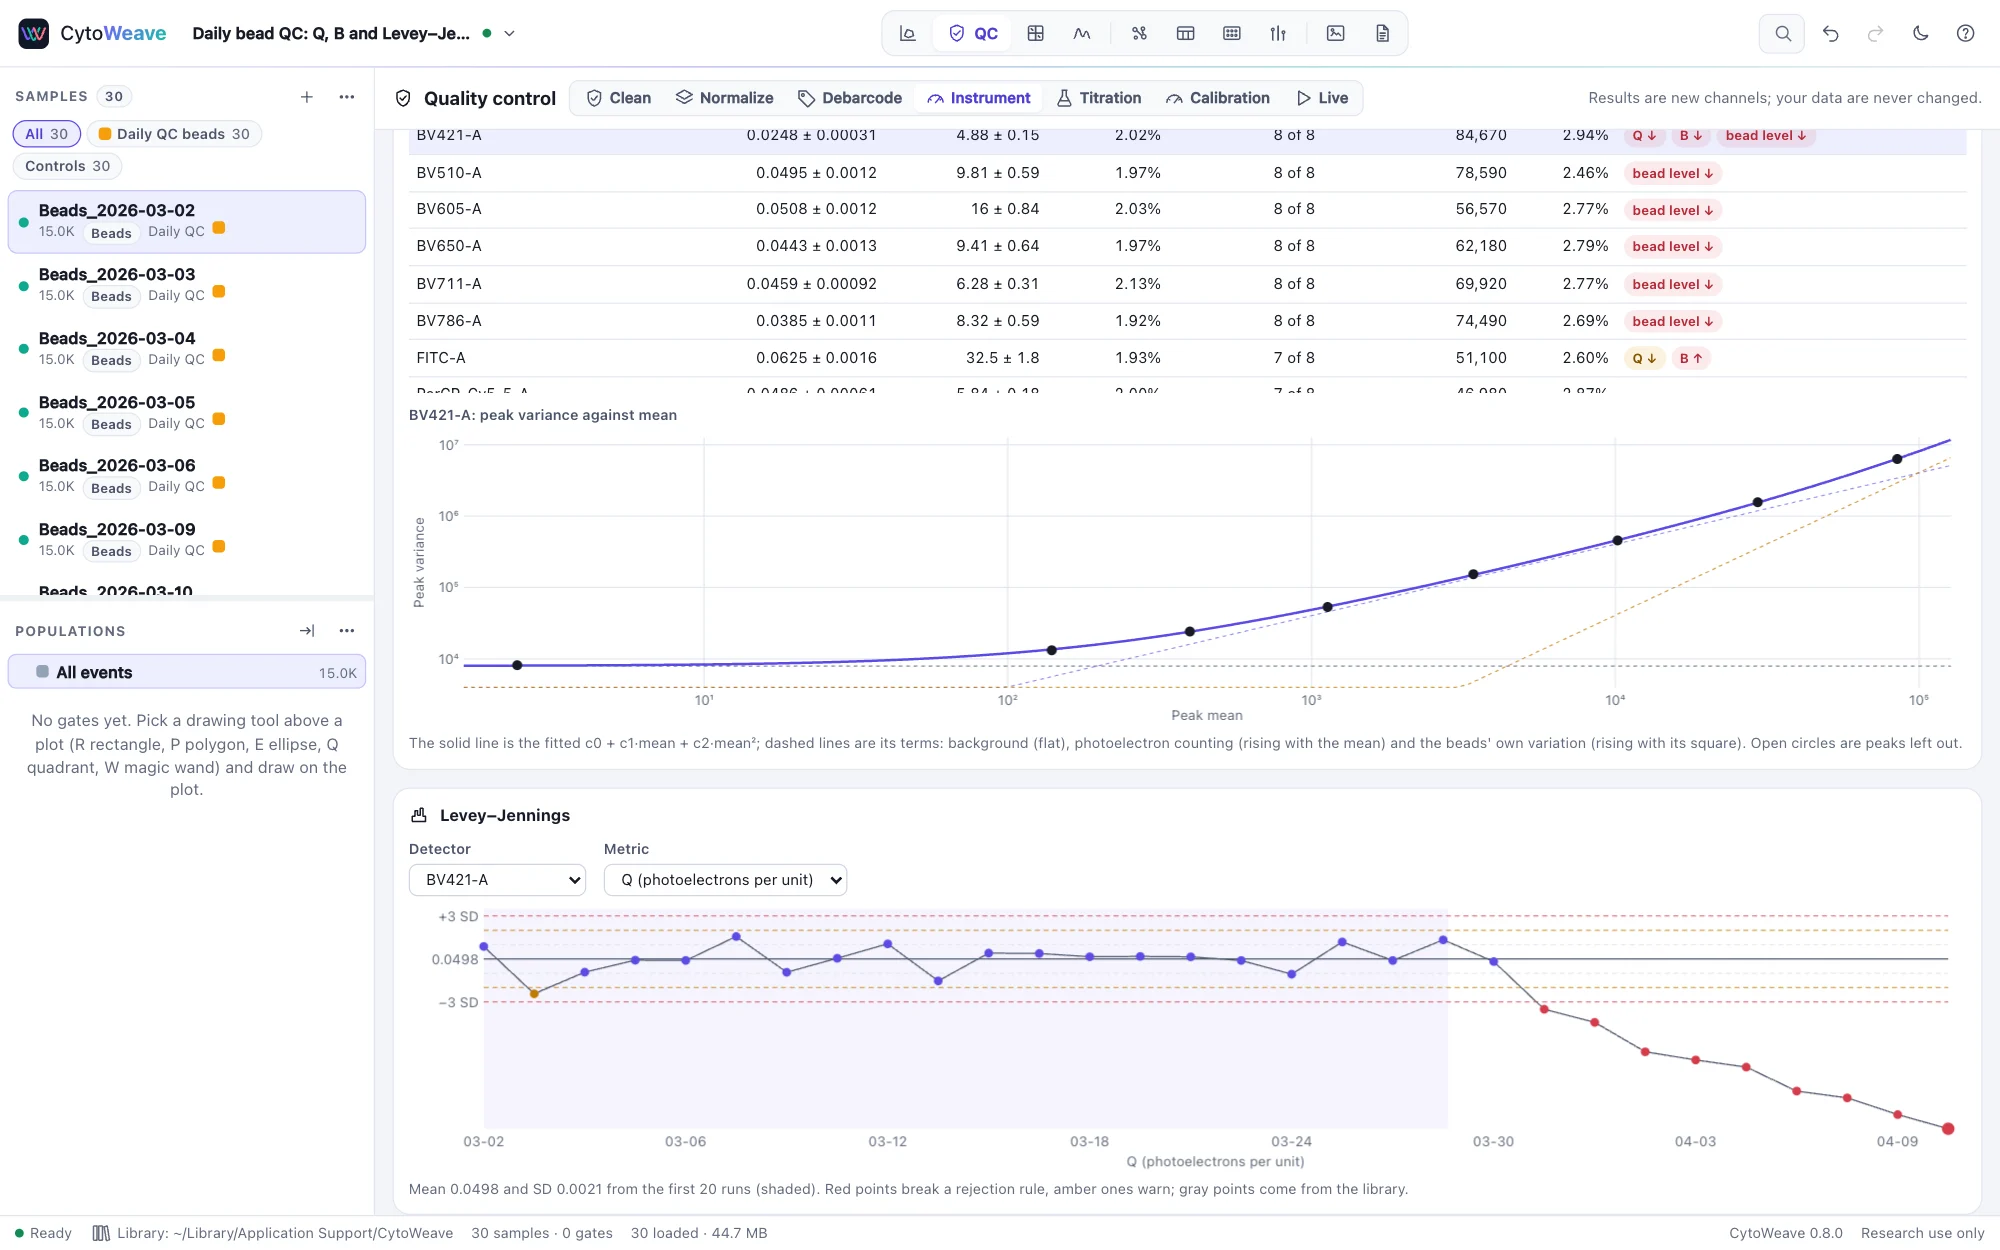
Know your cytometer: Q, B and every run since

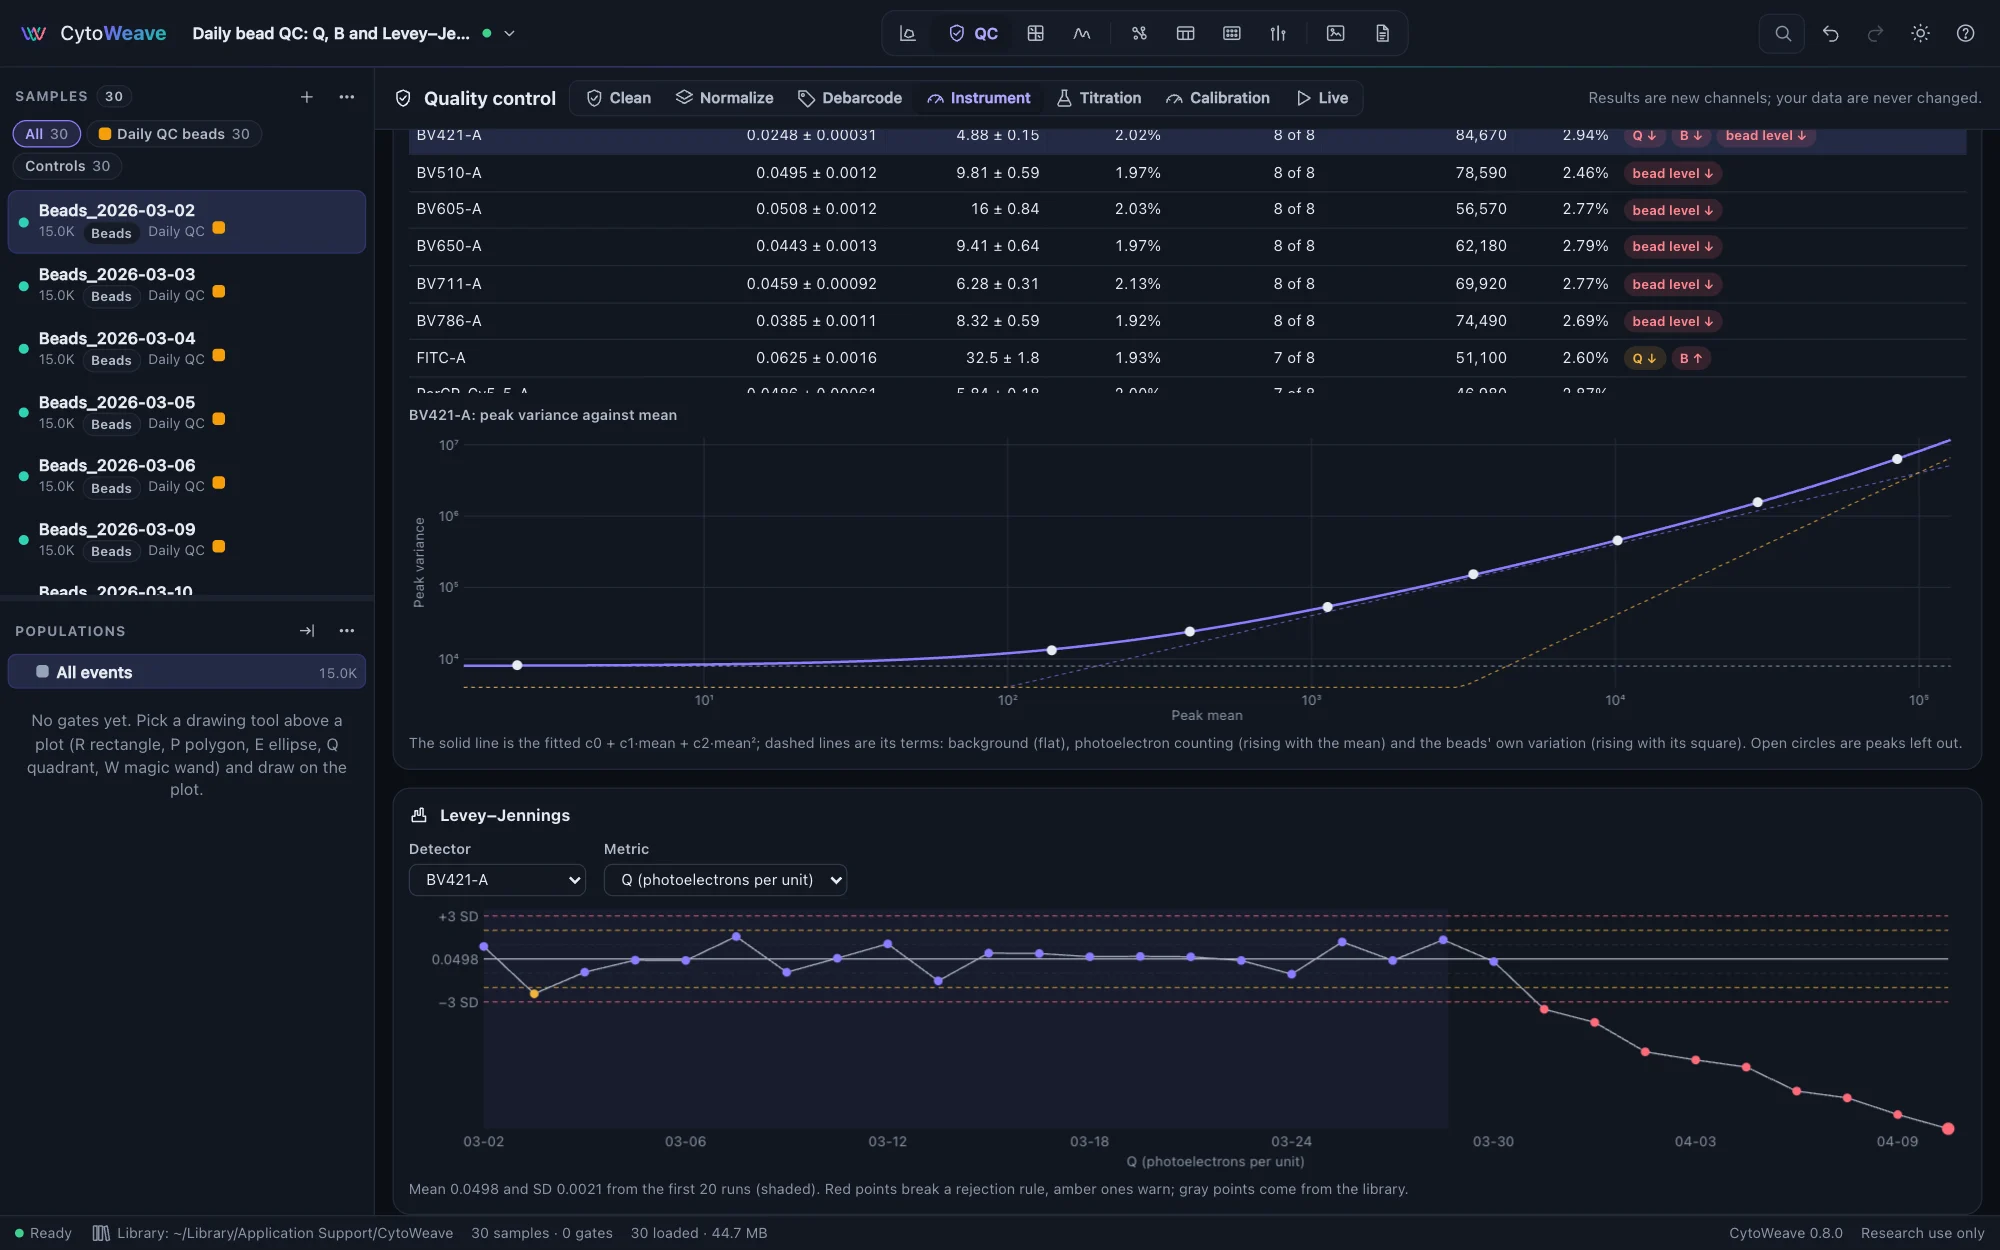
Measure every detector's efficiency Q and optical background B from multi-level beads or an LED pulser, with the weighted quadratic fit of Parks et al. that flowQB uses, and get flowQB's answers. Keep the runs in the instrument's record and follow them on Levey–Jennings charts: a failing PMT, a dirty flow cell or a weak laser shows on the day it happens.

  • Westgard rules against a baseline of runs
  • A spectral library that catches a degraded tandem
  • Library spectra for dyes you have no control for
Q, B and Levey–Jennings
A Levey–Jennings chart of one detector's Q over 30 daily bead runs: in control for 20 baseline runs, then falling out of controlA Levey–Jennings chart of one detector's Q over 30 daily bead runs: in control for 20 baseline runs, then falling out of control
An aging violet detector: its Q leaves the control limits the second day it fails.
Panel setup

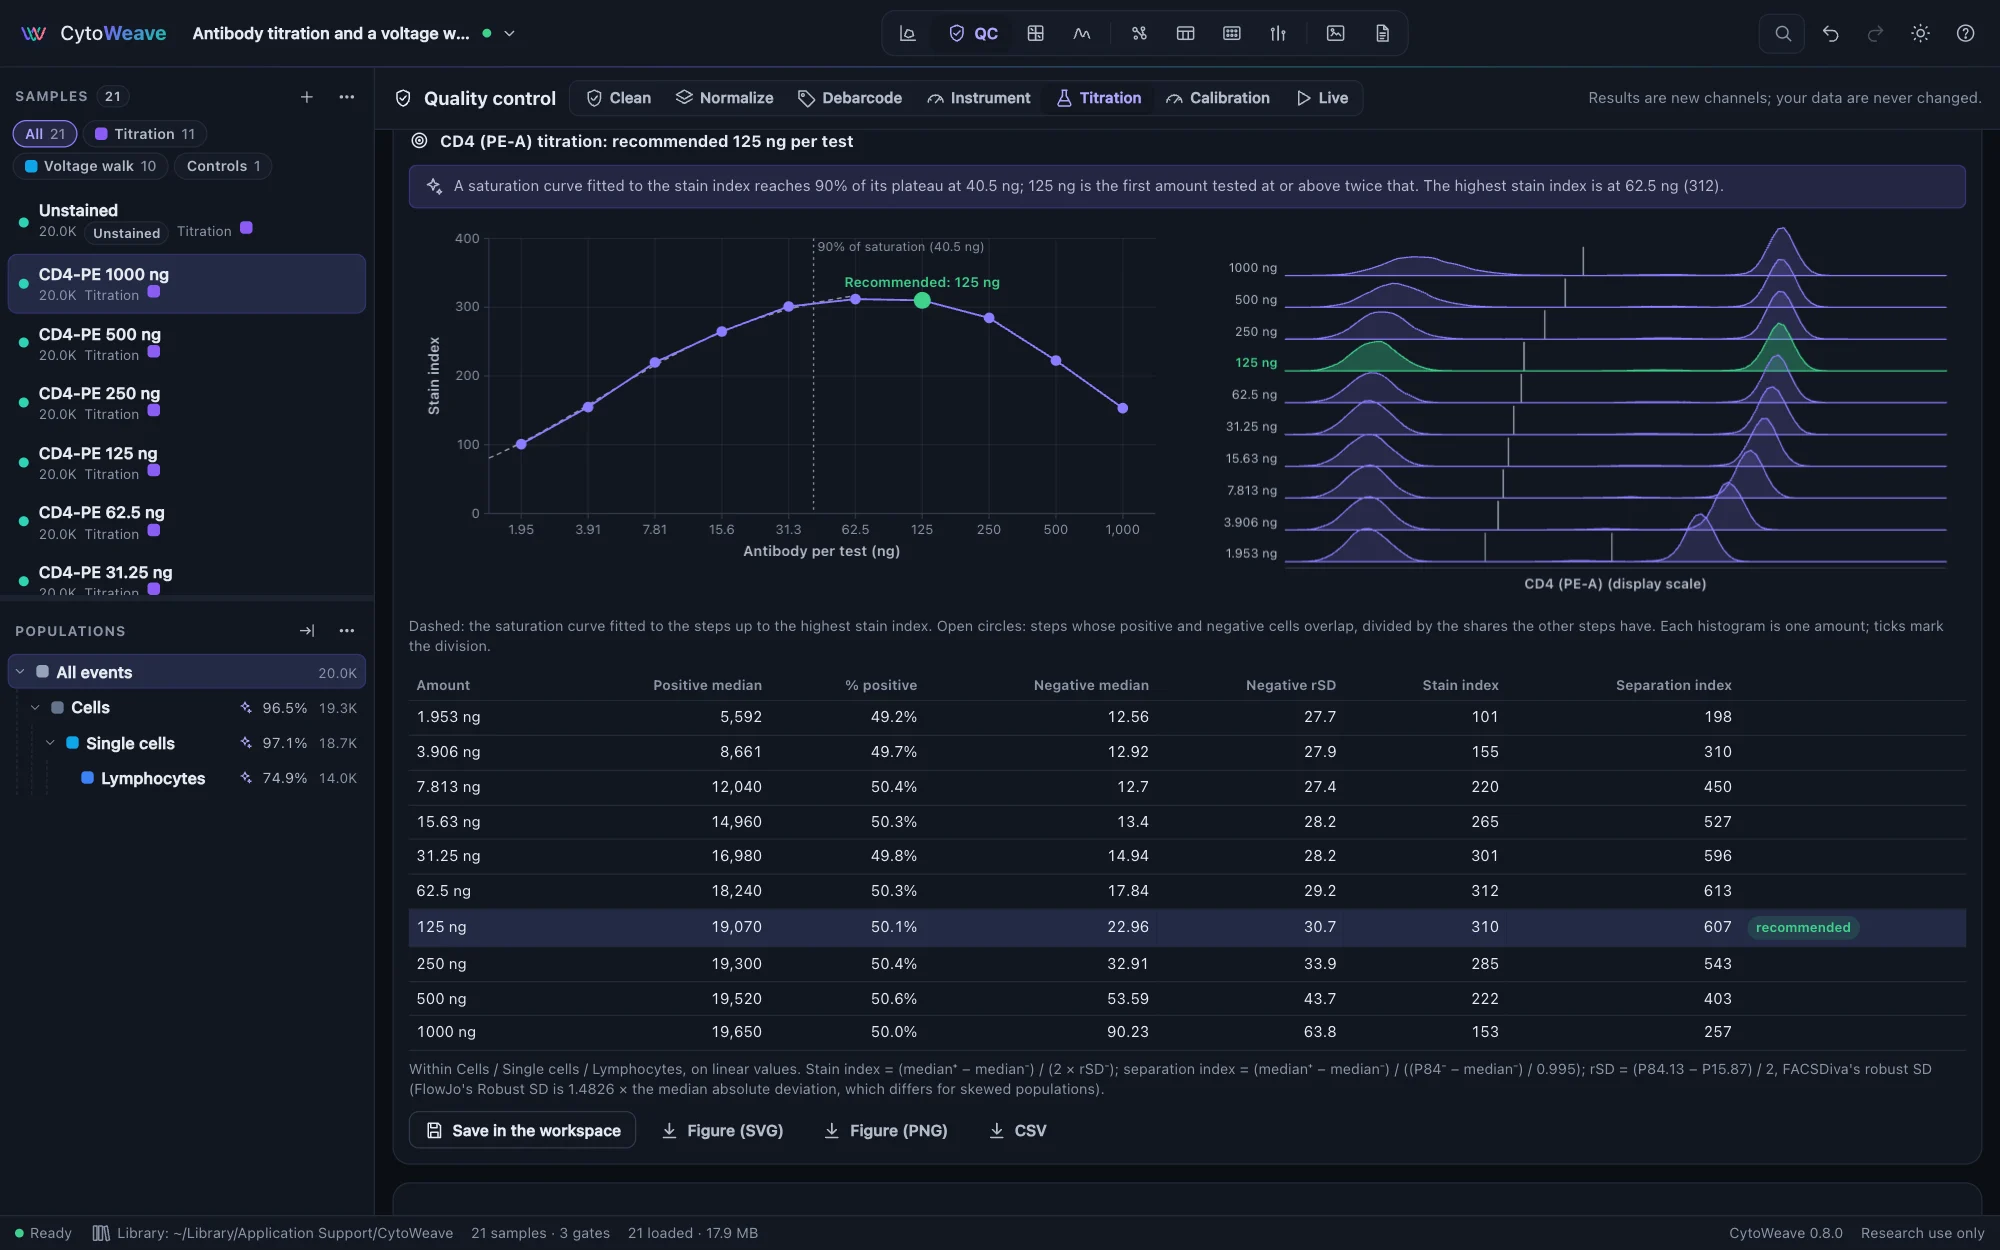
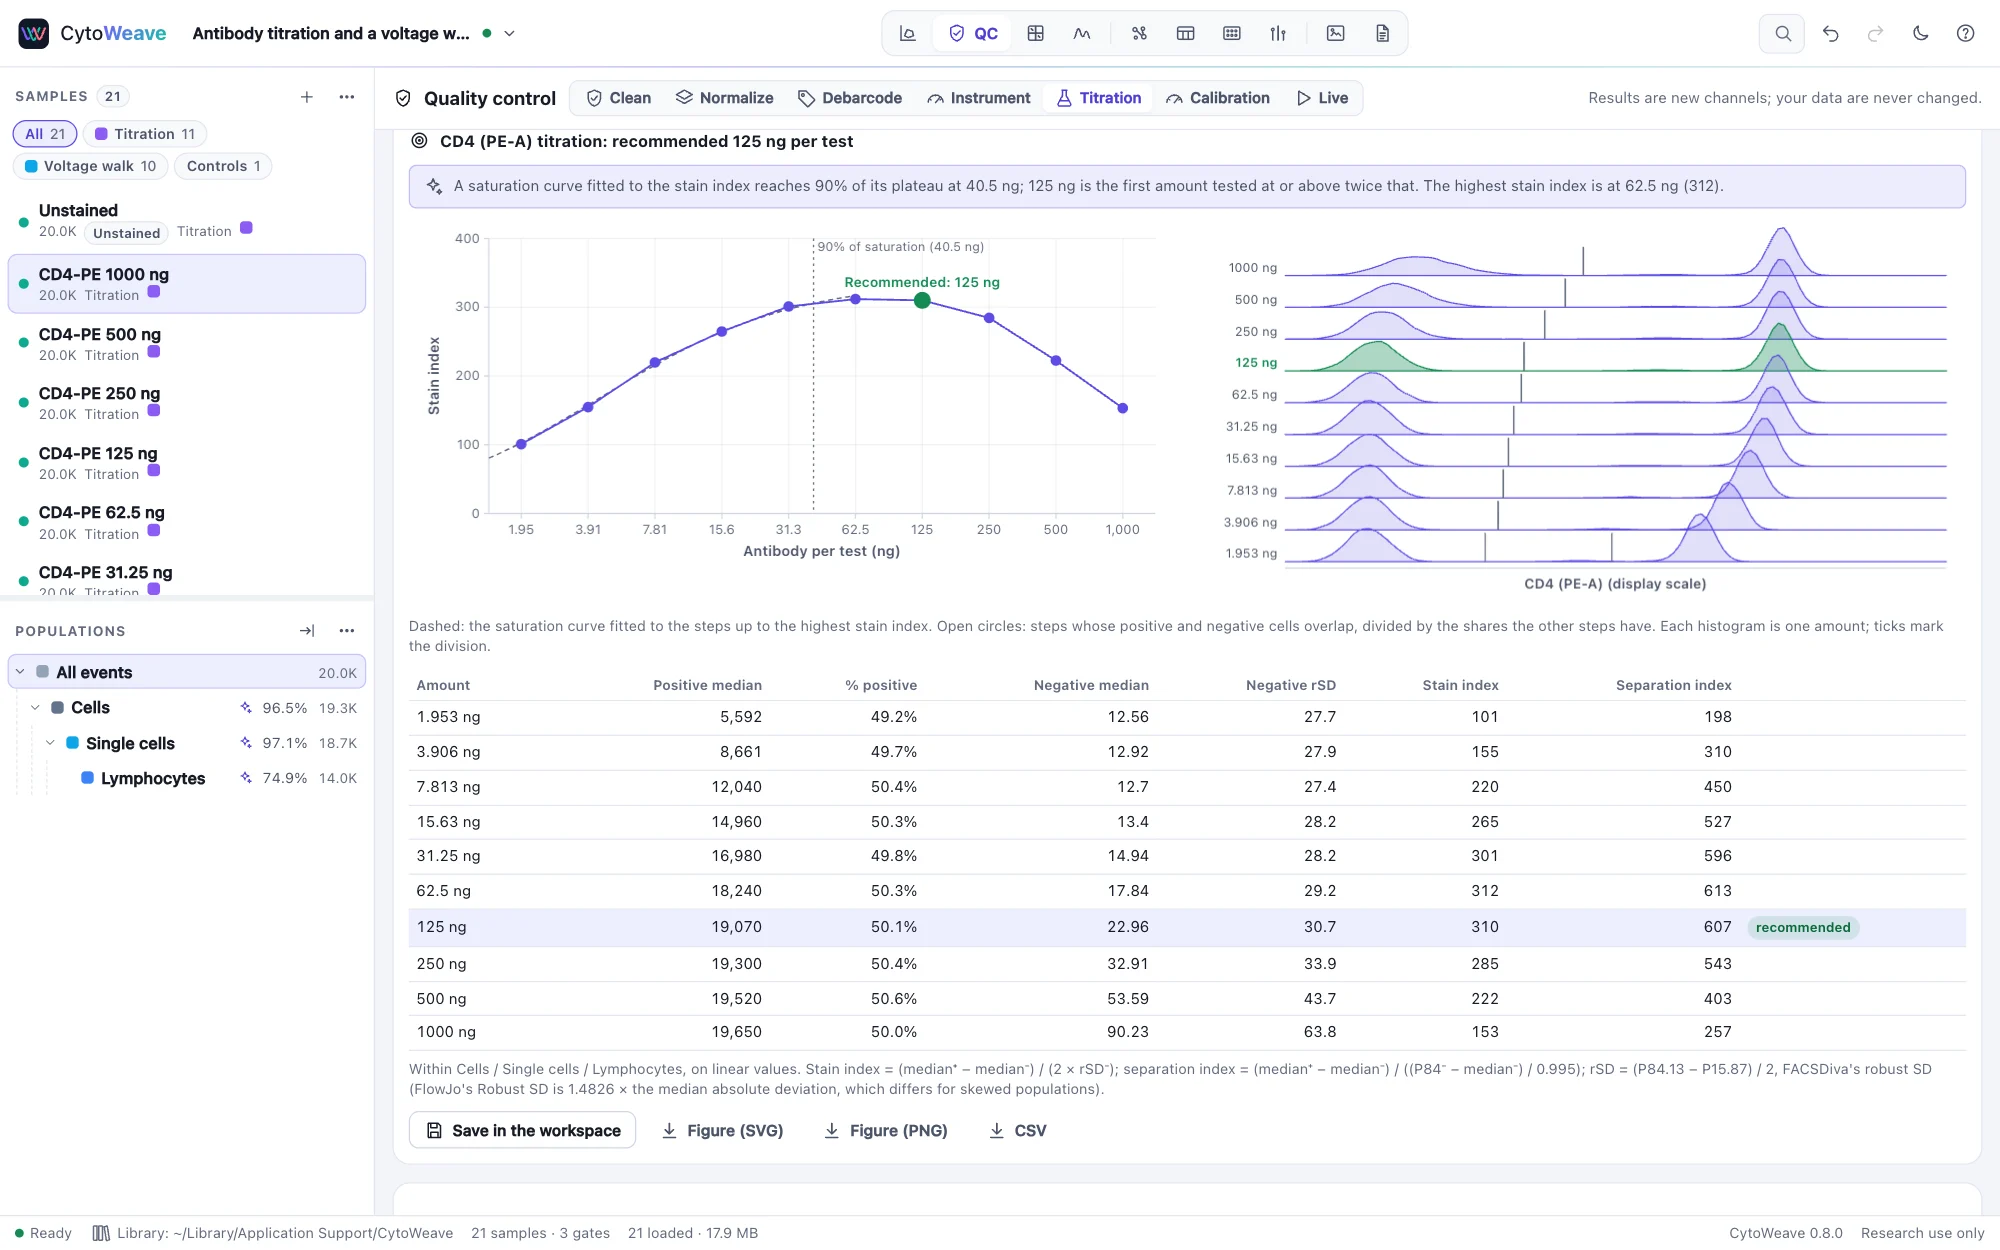
How much antibody, and which voltage

Name the files of a titration with their amounts, or let the files' own voltages describe a voltage walk. CytoWeave finds the positive and negative cells of every step and gives the stain and separation index, the amount to use (twice the amount that gives 90% of saturating staining) and the voltage range that lifts the negative cells above the detector's noise while keeping the bright ones in its linear range.

  • The reason for every recommendation, with its reference
  • A figure and a CSV for the panel's record
  • Checked against a simulated titration with known binding, noise and gain
Titration and voltage walks
A CD4-PE titration: the stain index against the amount with the fitted saturation curve and 125 ng recommended, and a histogram of every stepA CD4-PE titration: the stain index against the amount with the fitted saturation curve and 125 ng recommended, and a histogram of every step
CD4-PE titrated in ten steps: 125 ng recommended, twice the amount that gives 90% of saturating staining.
Clustering and maps

Maps that say how far to trust them

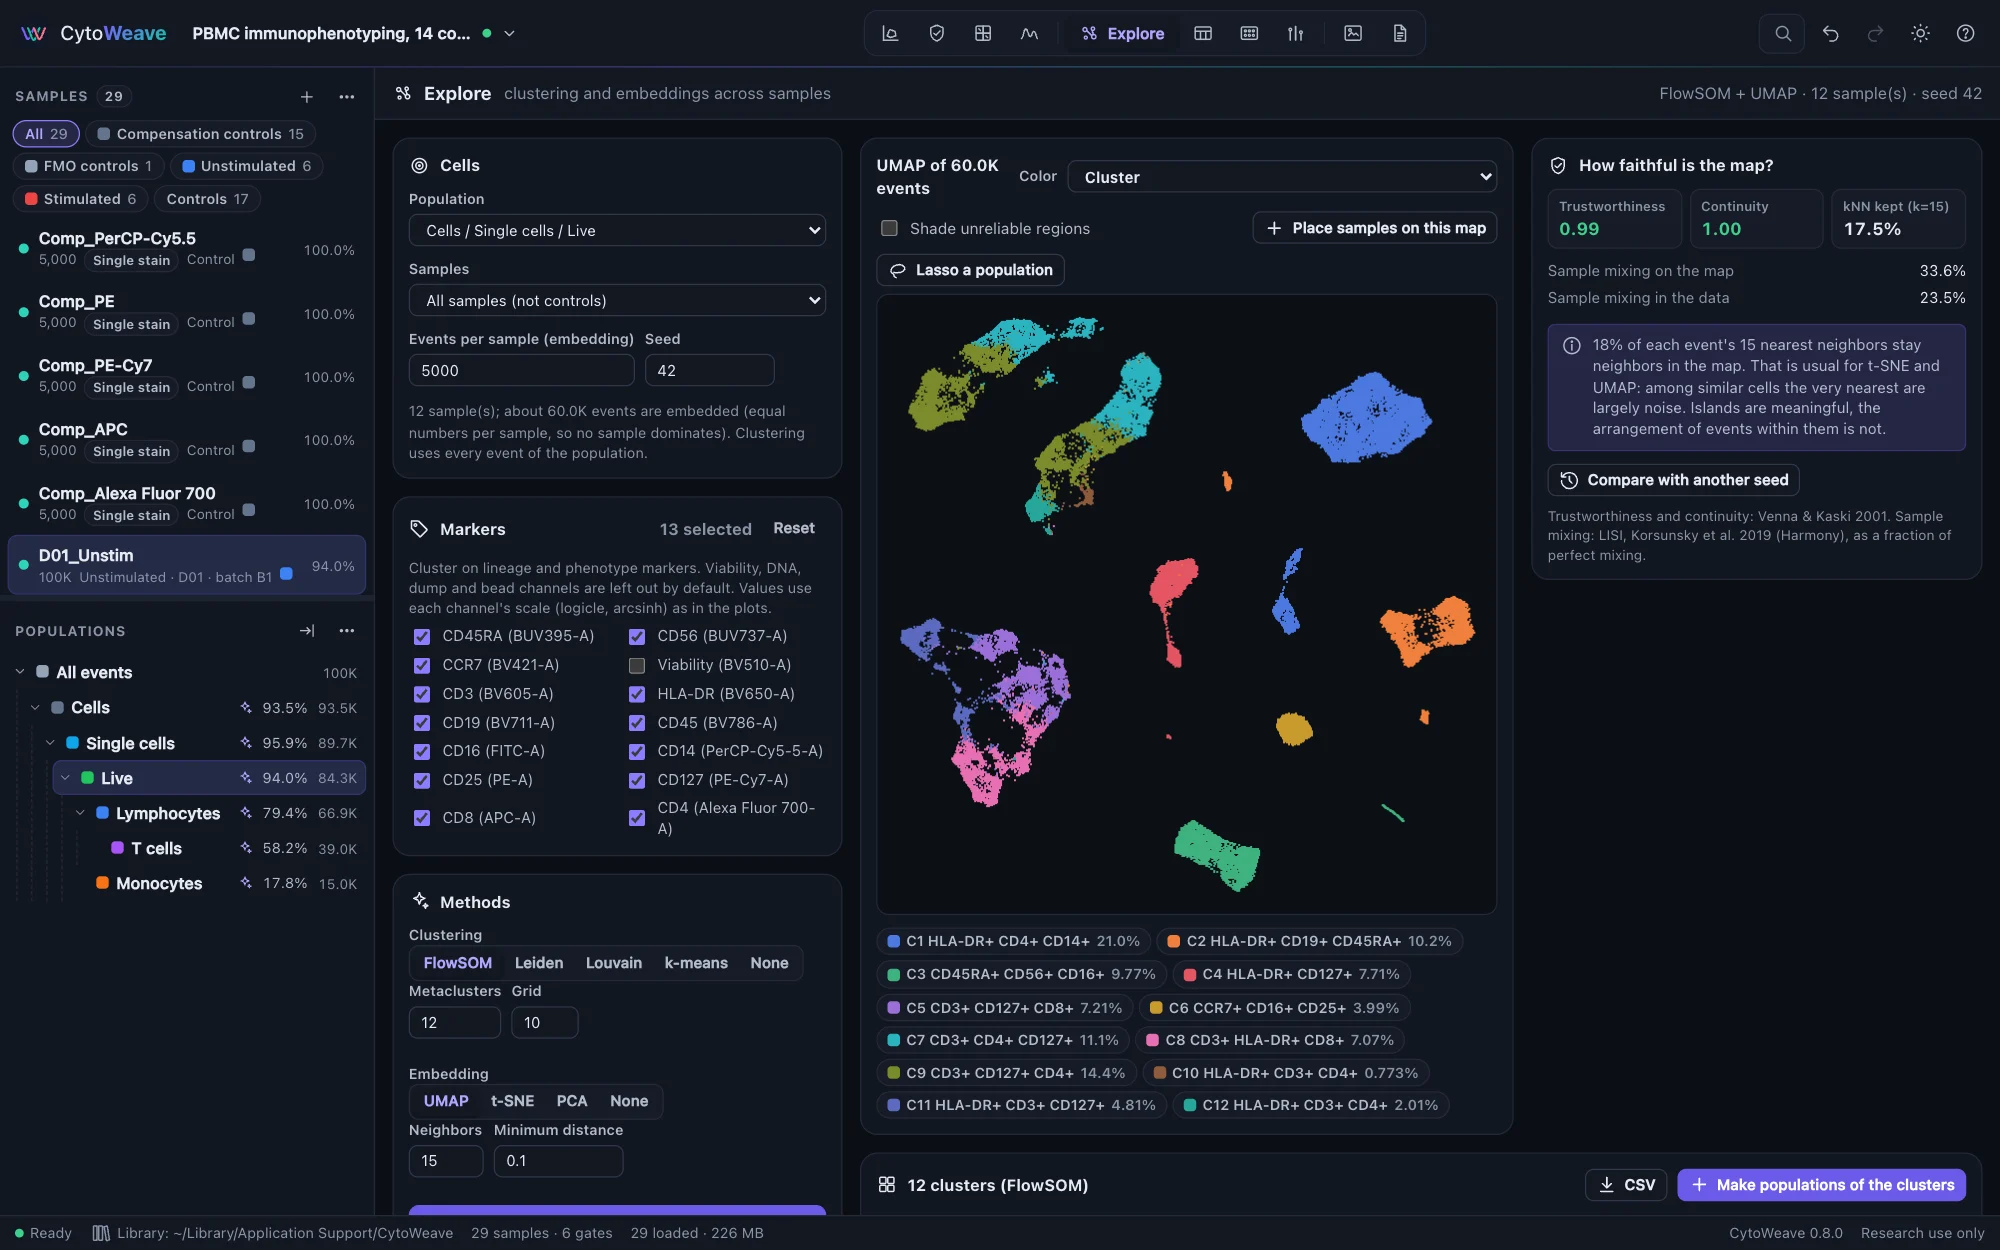
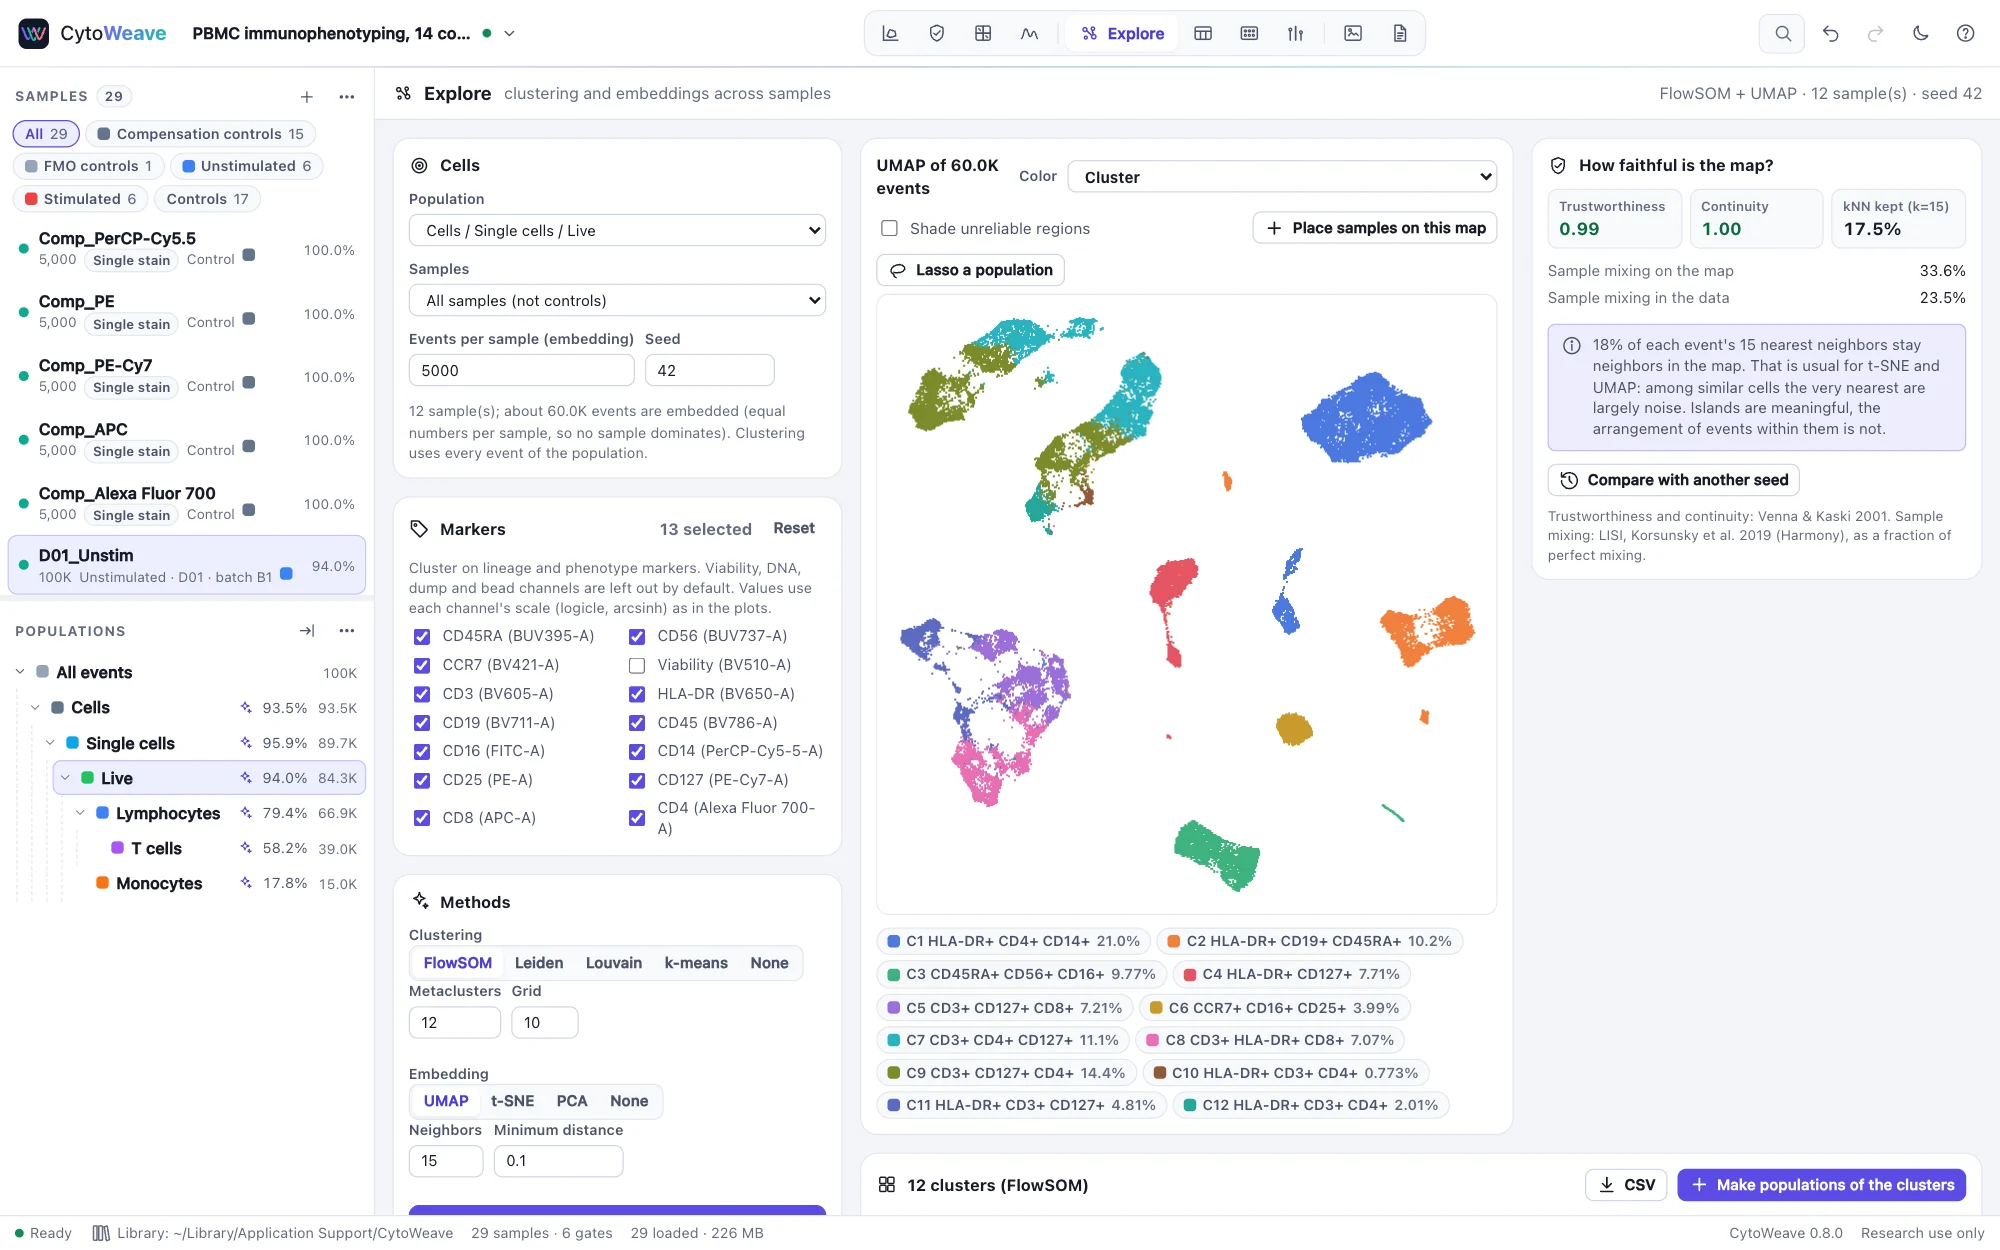
FlowSOM, Leiden, Louvain or k-means clustering, and UMAP, t-SNE or PCA across samples. Clusters are named from their marker enrichment and become gateable populations. Every map reports its trustworthiness, continuity, neighbor preservation, sample mixing and seed stability.

  • Shading of unreliable regions on the map
  • Later samples placed on a finished UMAP
  • Cluster abundance straight into group comparisons
Clustering and maps
The Explore view: a UMAP of 60,000 live cells from 12 samples colored by 12 FlowSOM clusters, with trustworthiness and continuity of 0.99The Explore view: a UMAP of 60,000 live cells from 12 samples colored by 12 FlowSOM clusters, with trustworthiness and continuity of 0.99
FlowSOM clusters on a UMAP of 12 samples, with the map's faithfulness and a plain-language reading.
Review

Every sample's result for a gate, outliers first

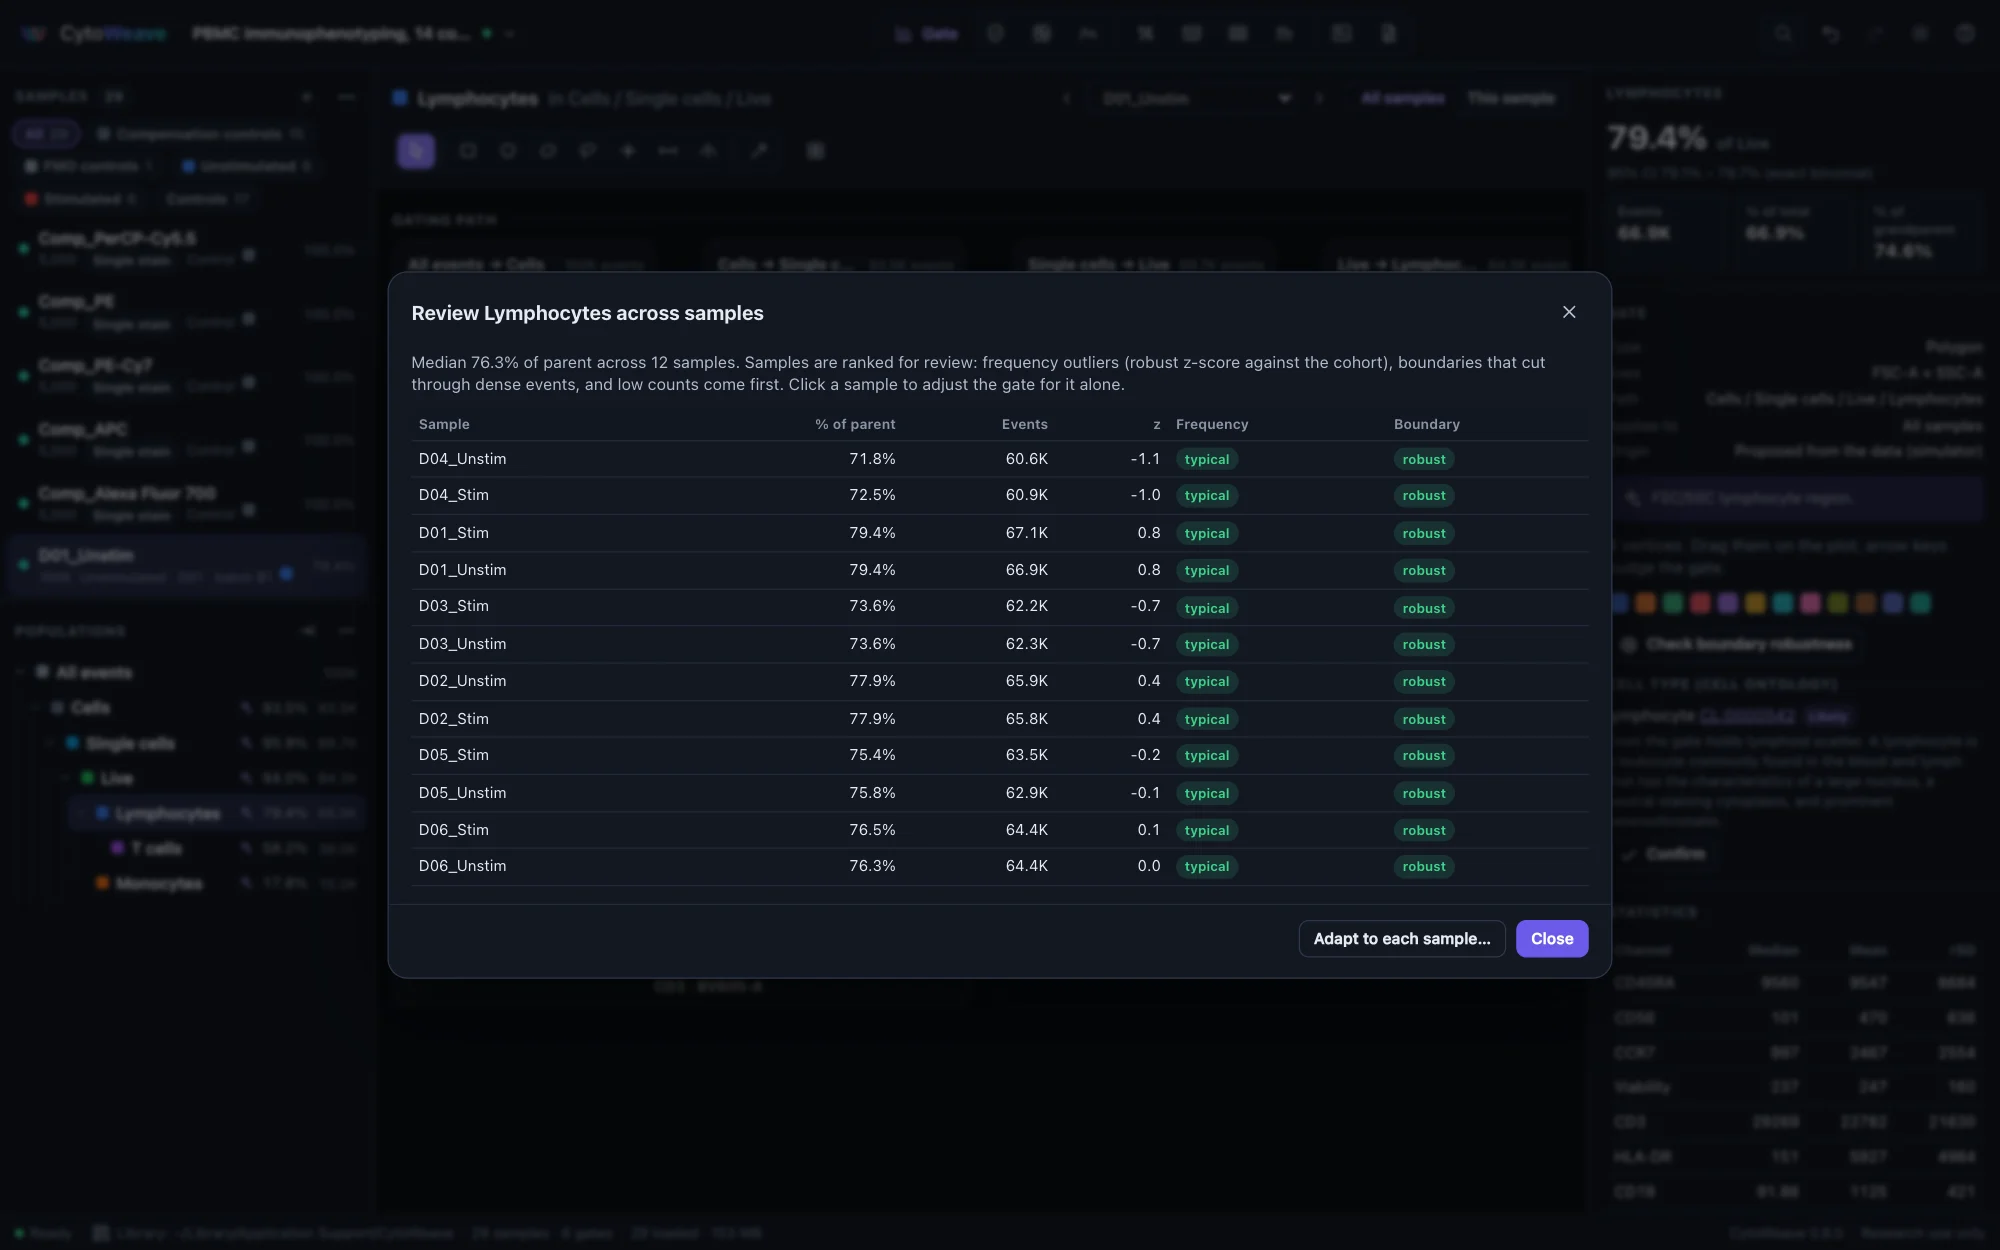
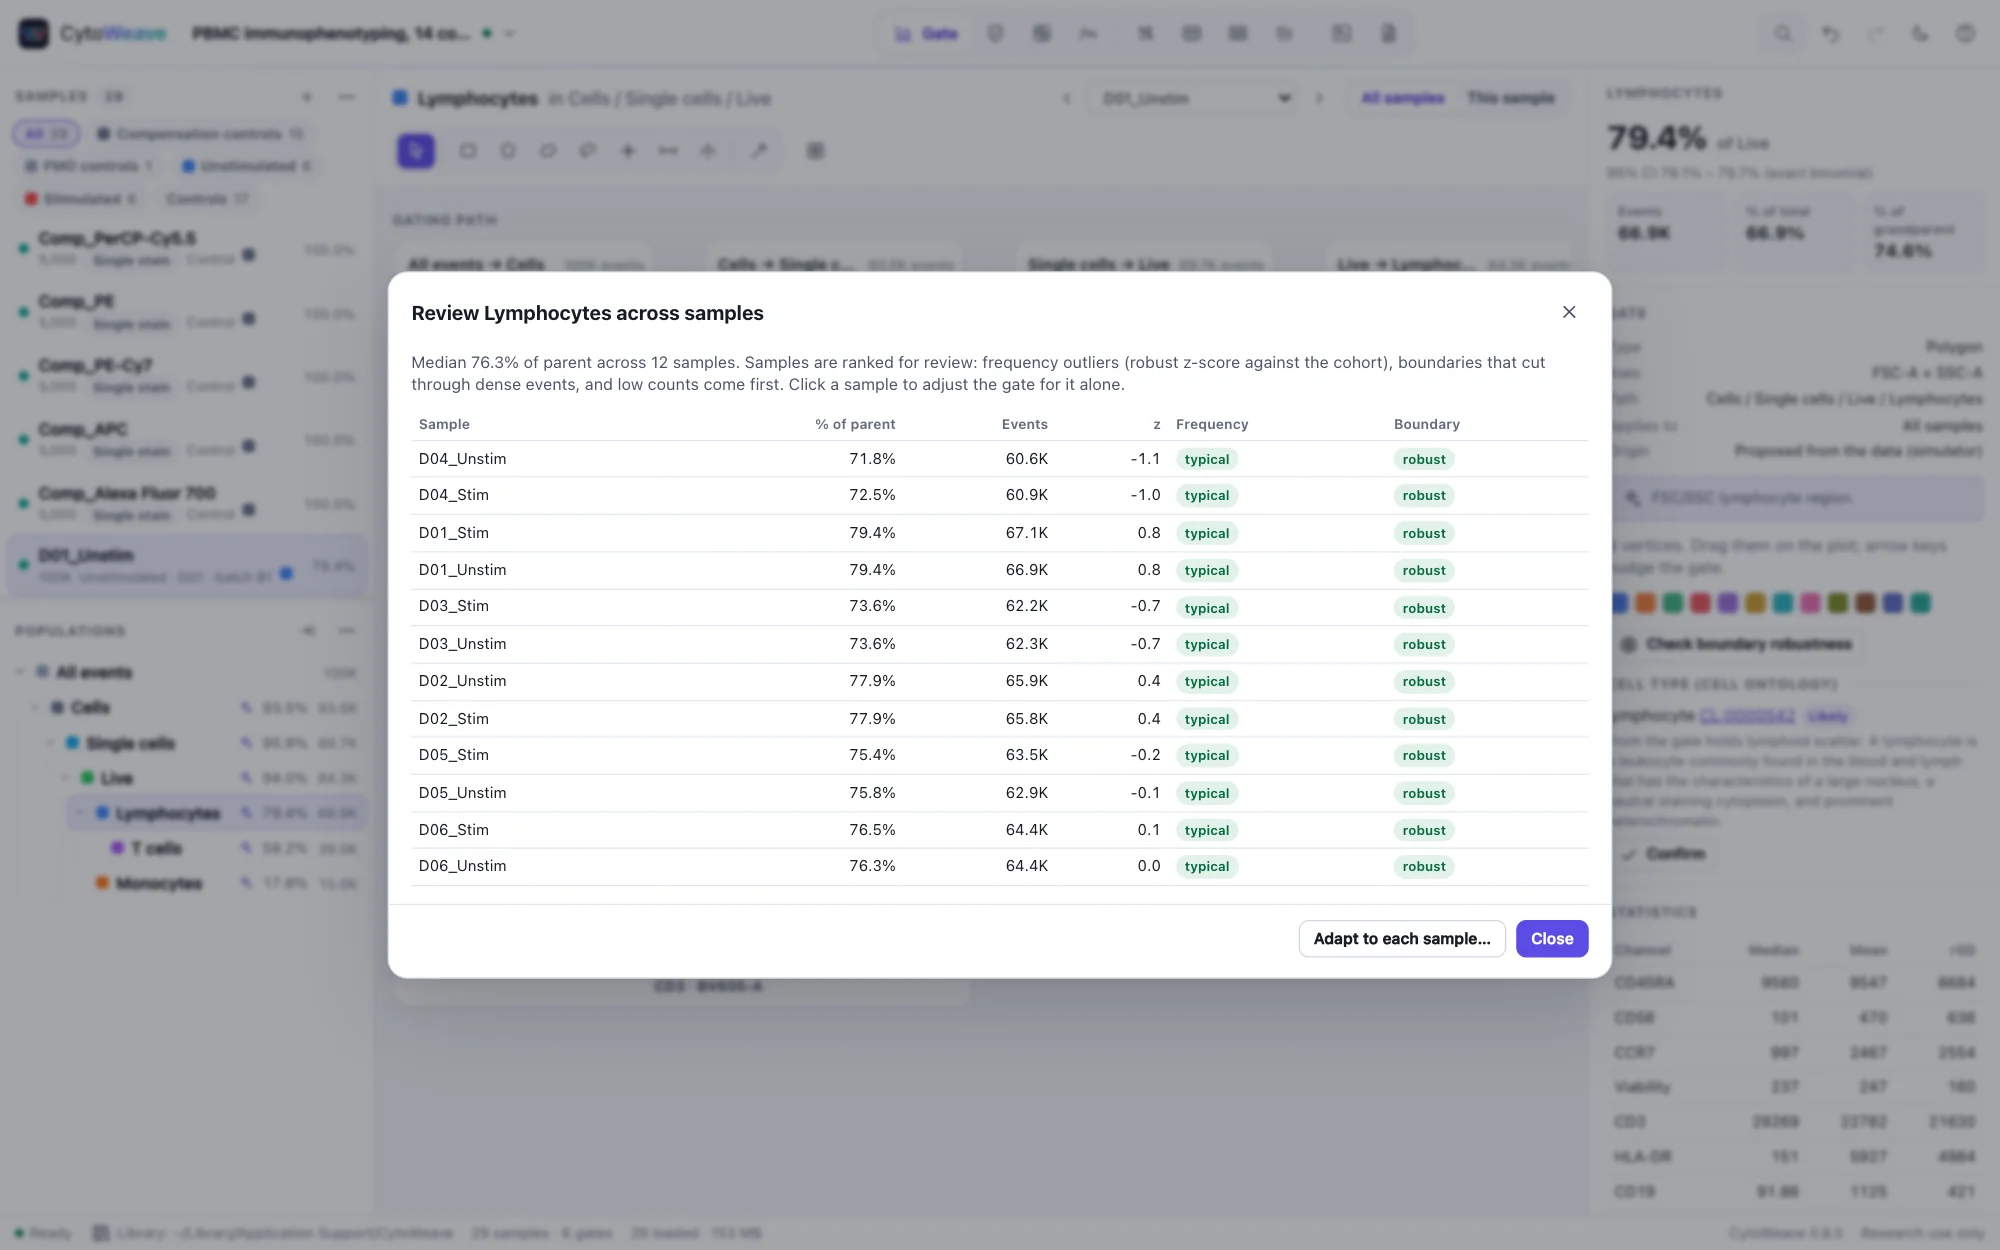
Review a gate across the cohort: samples are ranked by how unusual their frequency is, by whether the boundary cuts through dense events, and by low counts. Boundary robustness shows how much a frequency depends on exactly where the gate was drawn.

  • Robust z-scores against the cohort
  • Click a sample to adjust the gate for it alone
  • Overrides stay visible in the population tree
Review across samples
Review Lymphocytes across samples: 12 samples with their percentage of parent, event counts, robust z-scores, and typical frequency and robust boundary ratingsReview Lymphocytes across samples: 12 samples with their percentage of parent, event counts, robust z-scores, and typical frequency and robust boundary ratings
The lymphocyte gate on 12 samples: every frequency typical, every boundary robust.
Autogating

Gates that follow drifting samples, and say when they can't

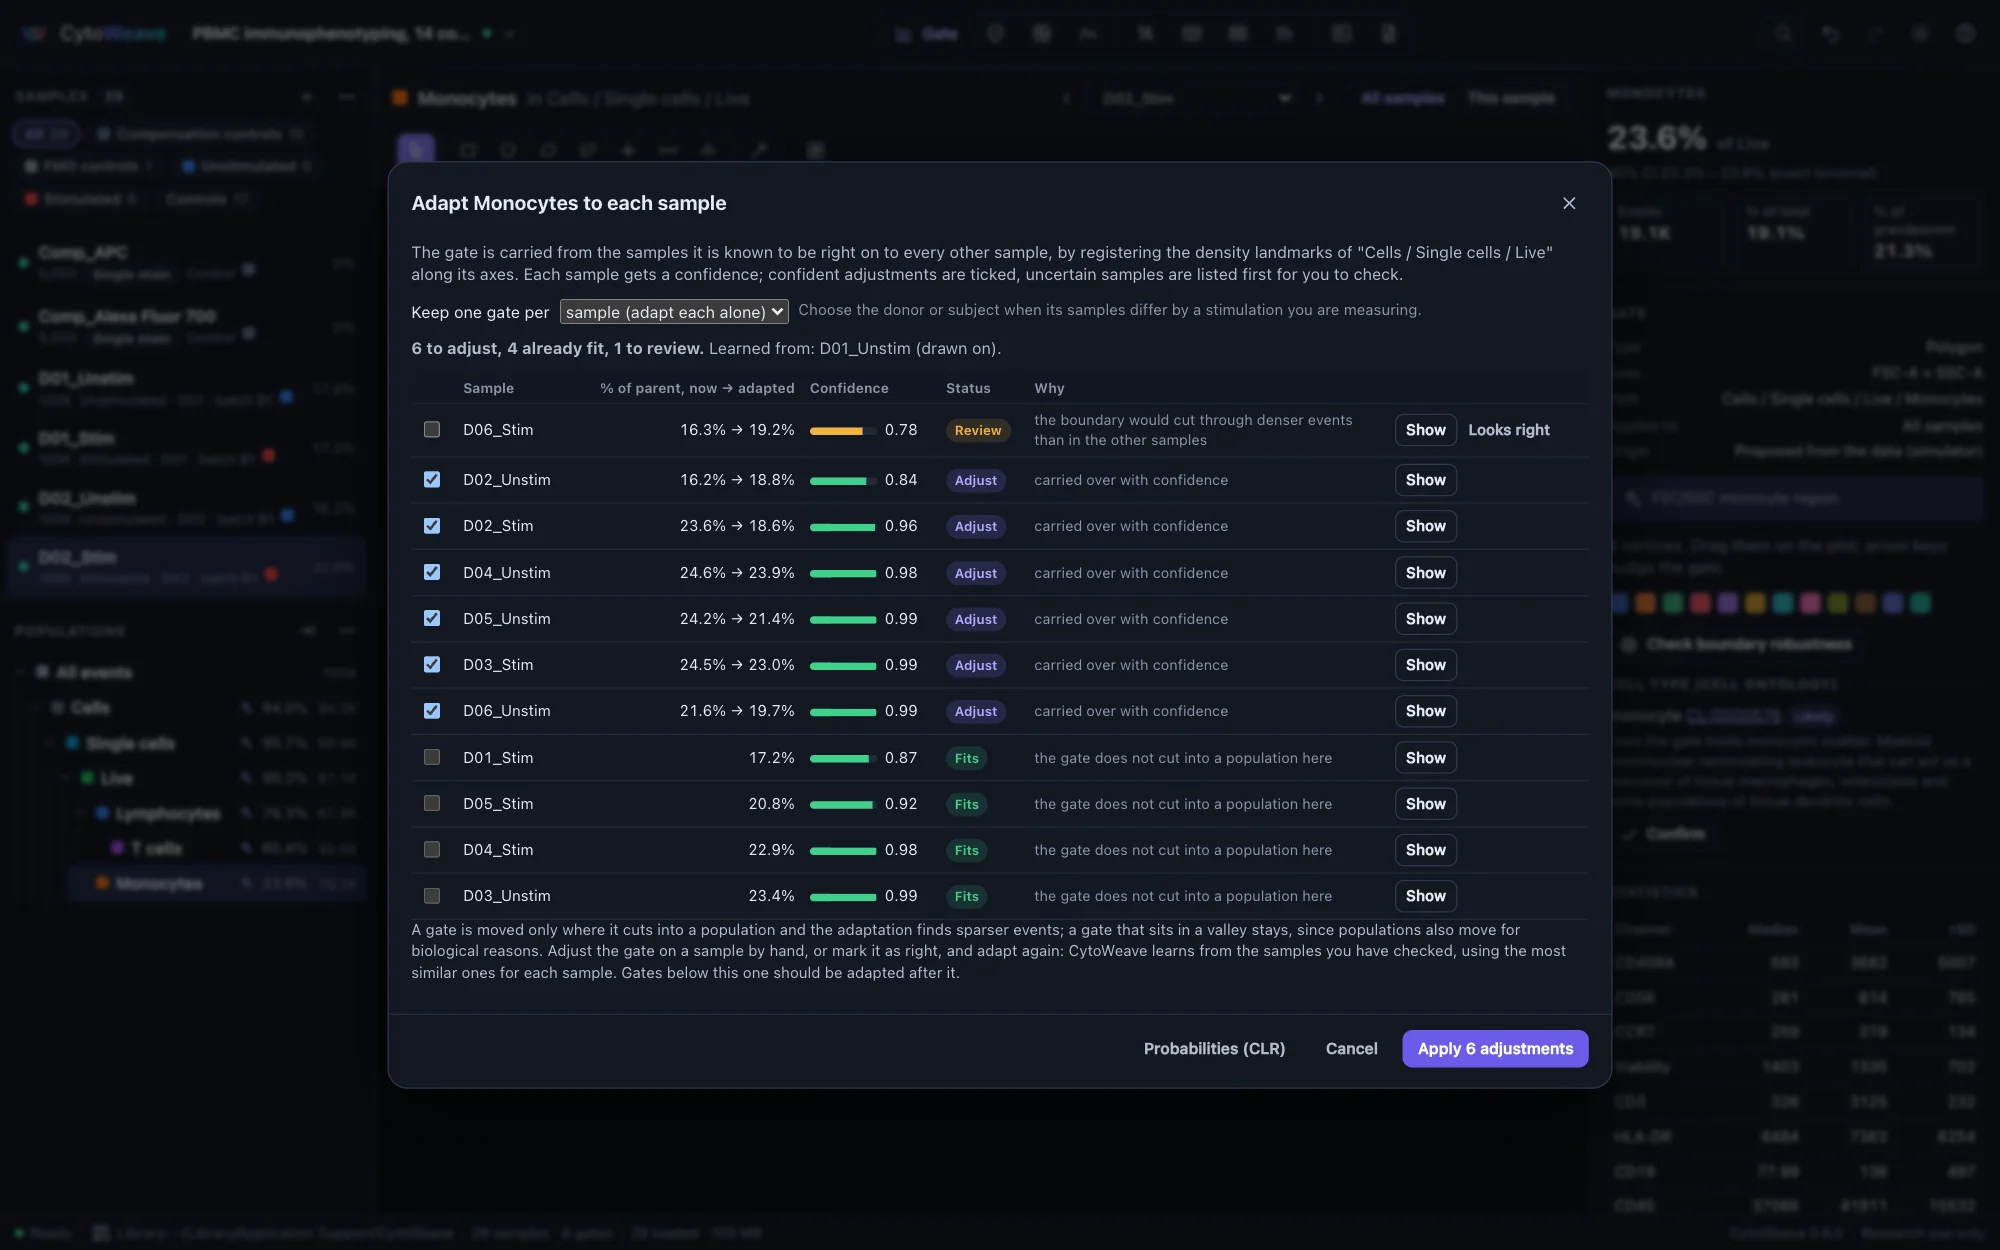
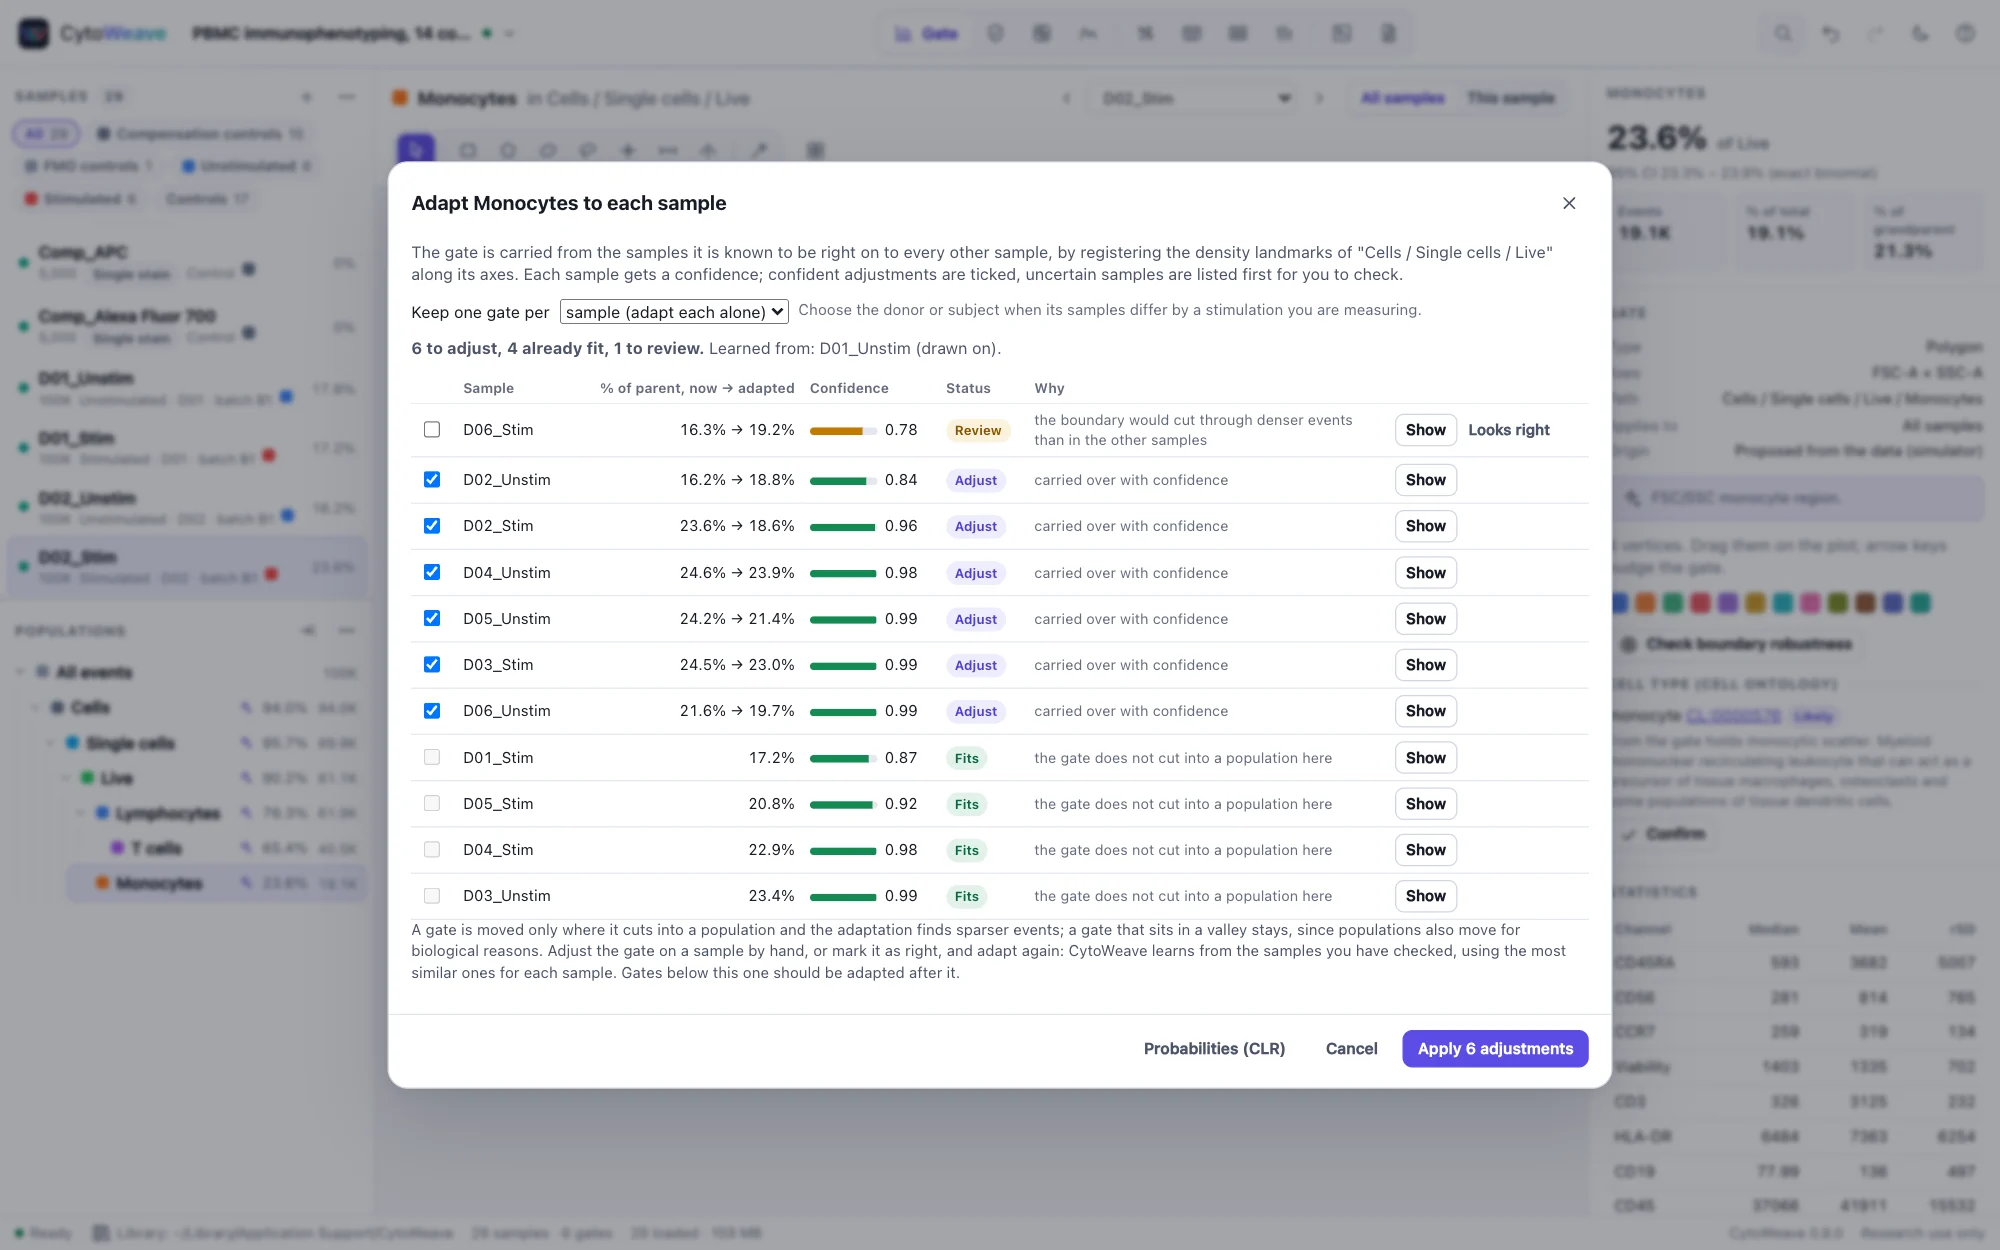
Adapt a gate to every sample: CytoWeave learns from the samples you drew, adjusted or confirmed it on, carries it across by the density peaks of the parent population, and gives each sample a confidence. Confident adjustments are ticked for you to apply; uncertain samples come first, with the reason. A gate that sits in a valley stays, because populations also move for biological reasons.

  • One gate per donor for stimulation assays
  • Checked against an expert's own gates in a real cytokine study
  • Membership probabilities for every event, as CLR
Adapting a gate to each sample
Adapt Monocytes to each sample: six confident adjustments ticked, four samples that already fit and one sent to review, each with its confidence and reasonAdapt Monocytes to each sample: six confident adjustments ticked, four samples that already fit and one sent to review, each with its confidence and reason
The monocyte gate adapted to samples acquired with drifting detector gains: six adjustments, four that fit, one to check.
Statistics

The right test for the design

Statistics tables of every population across samples, and group comparisons that pick the test from the design: Welch's t-test, paired t-test, Welch's ANOVA or repeated-measures ANOVA, each with its nonparametric counterpart, effect sizes and bootstrap confidence intervals.

  • Paired designs detected from a subject field
  • % positive against a control: SED, Overton and probability binning, equal to flowStats
  • Exact intervals and detection limits for rare populations
  • Benjamini–Hochberg, Benjamini–Yekutieli, Holm or Bonferroni
Tables and comparisons
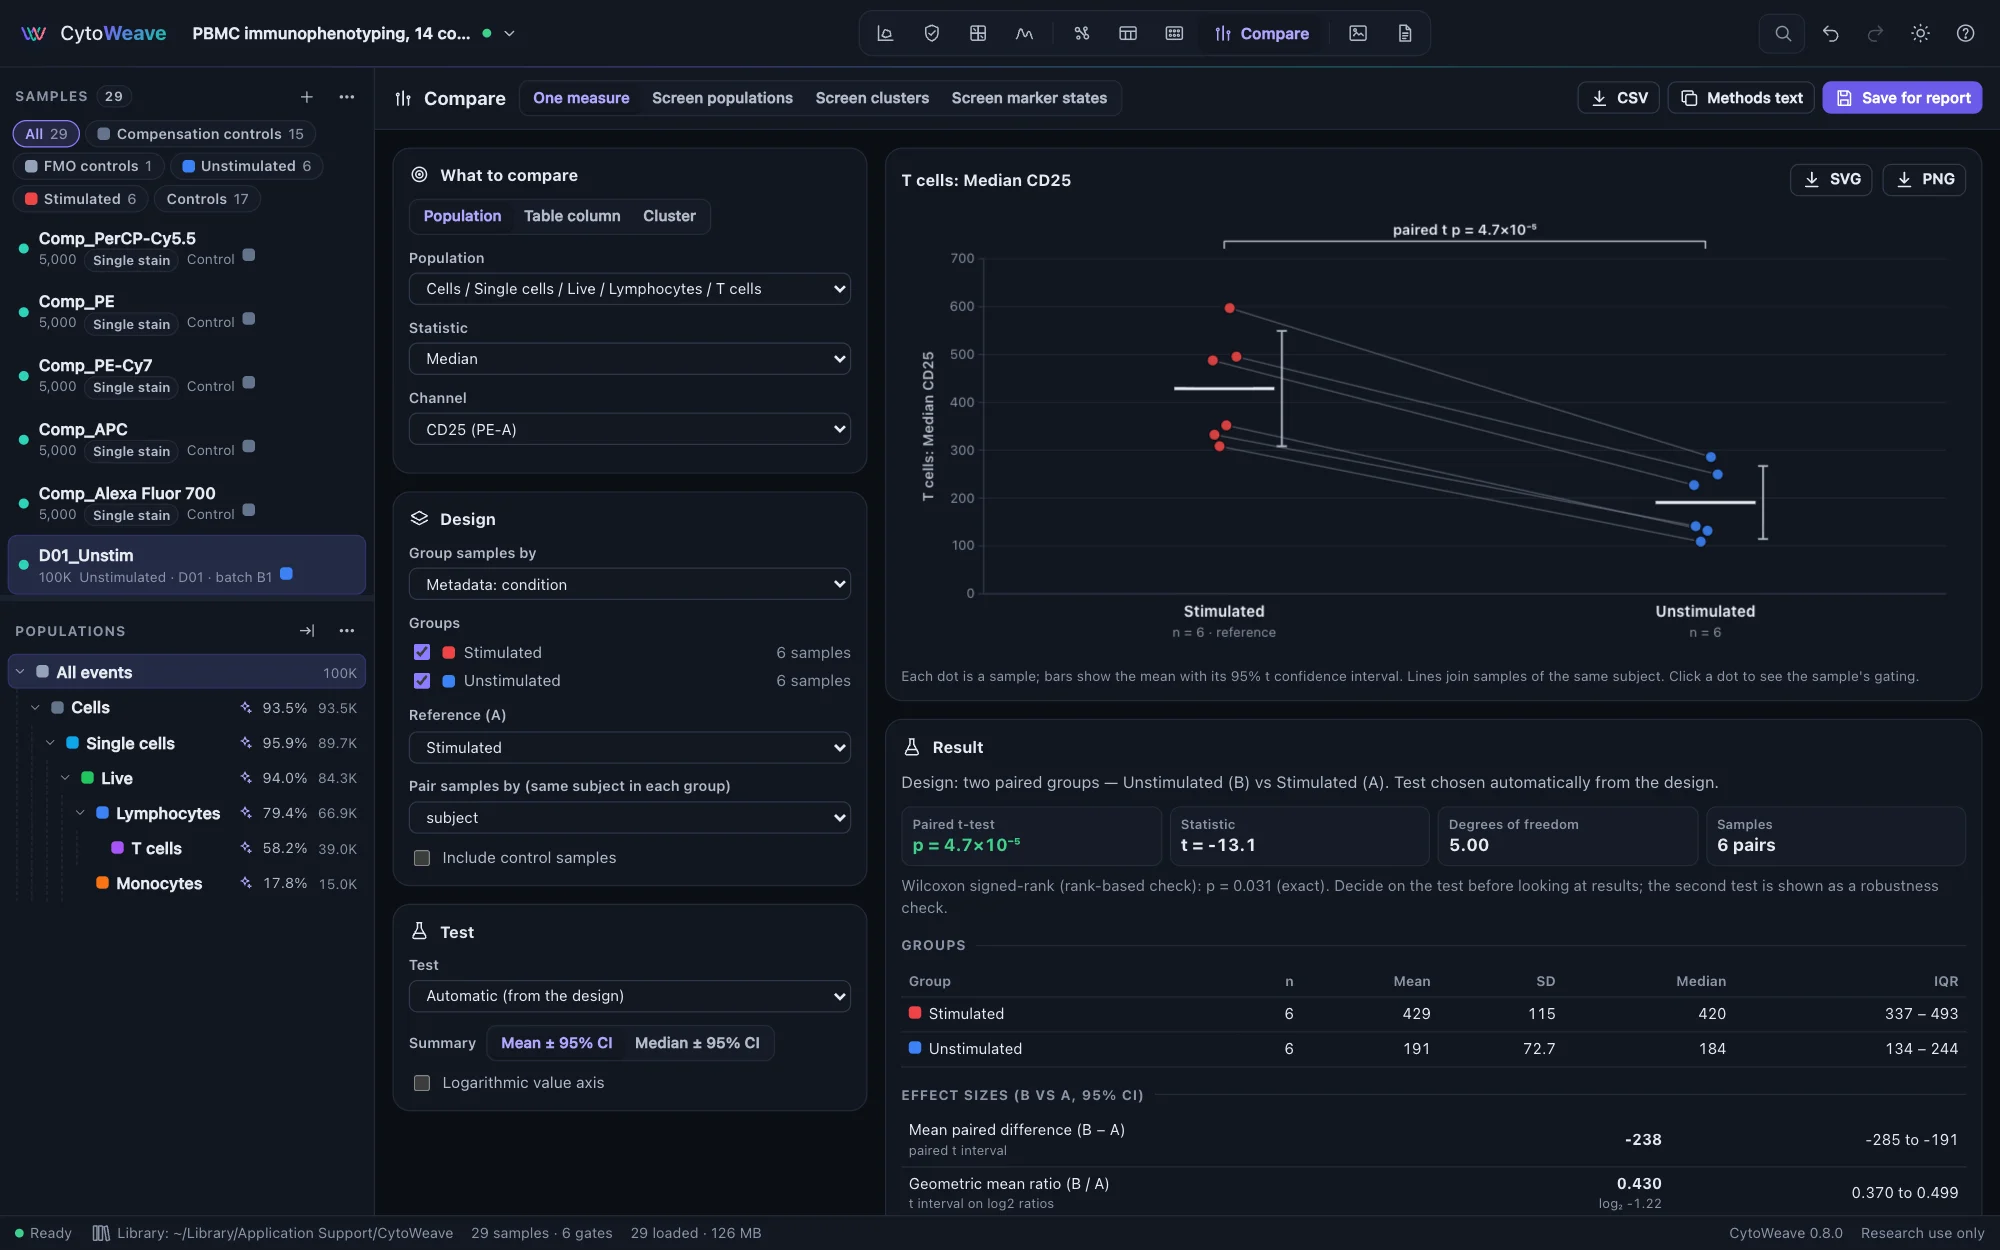
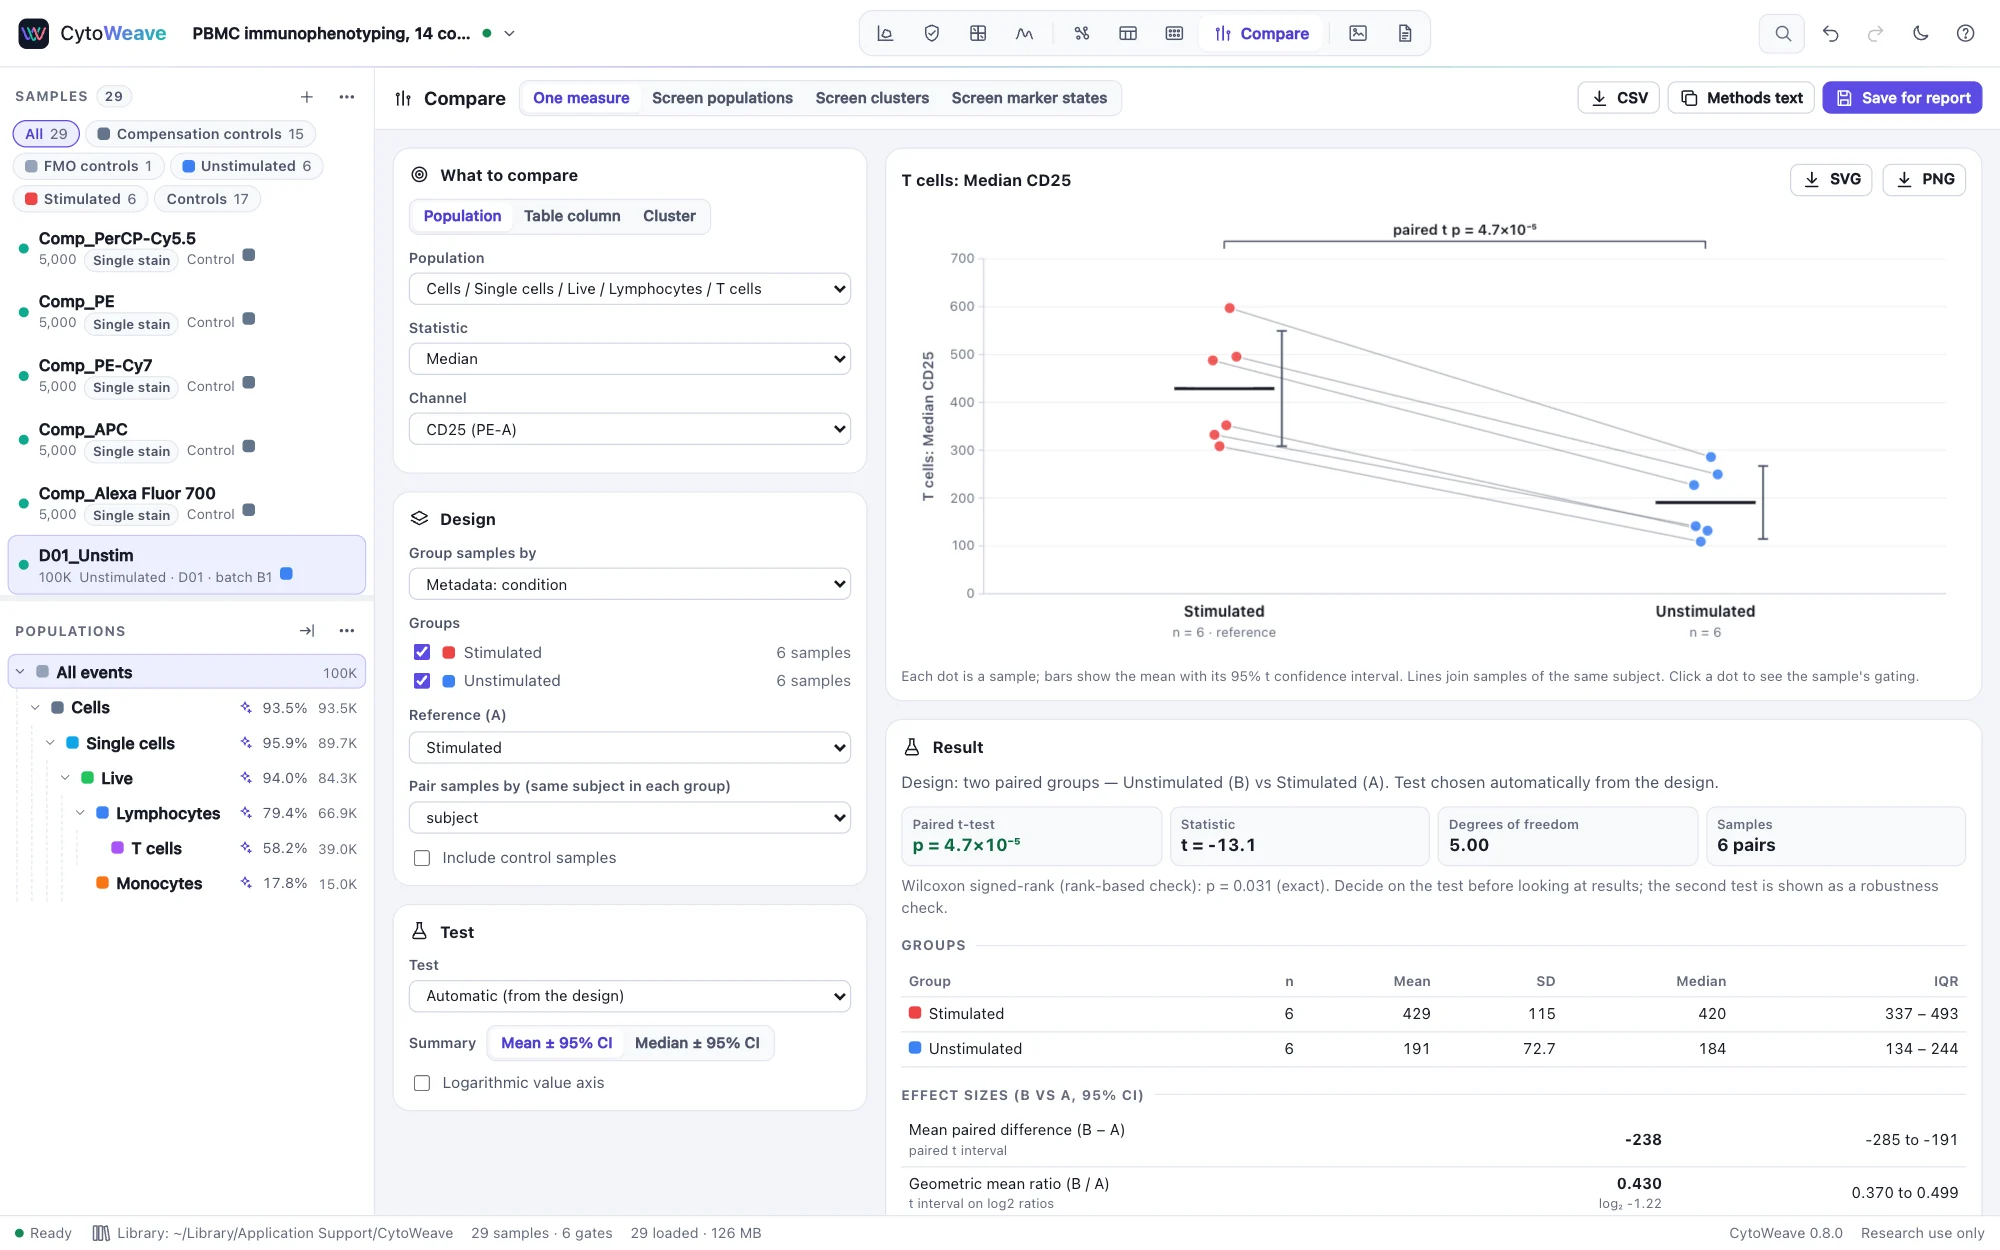
The Compare view: the median CD25 of T cells in stimulated and unstimulated samples, with the paired test, effect size and confidence intervalThe Compare view: the median CD25 of T cells in stimulated and unstimulated samples, with the paired test, effect size and confidence interval
Median CD25 on T cells, stimulated against unstimulated: six donors, paired by subject, so the paired t-test was chosen.
Robustness

Would another analyst reach the same conclusion?

A comparison rests on choices made before any test: where each gate was drawn, whether it was adjusted per sample, whether QC was applied, which compensation matrix was used. CytoWeave repeats the comparison 64 times with those choices made differently, alone and in combination, says whether the conclusion holds, mostly holds or is fragile, and names the choices it depends on.

  • A specification curve of every analysis, with its confidence interval
  • Gain shifts, clogs and a stale matrix traced to the choice behind them
  • A sentence on the check in the methods text
Robustness to analysis choices
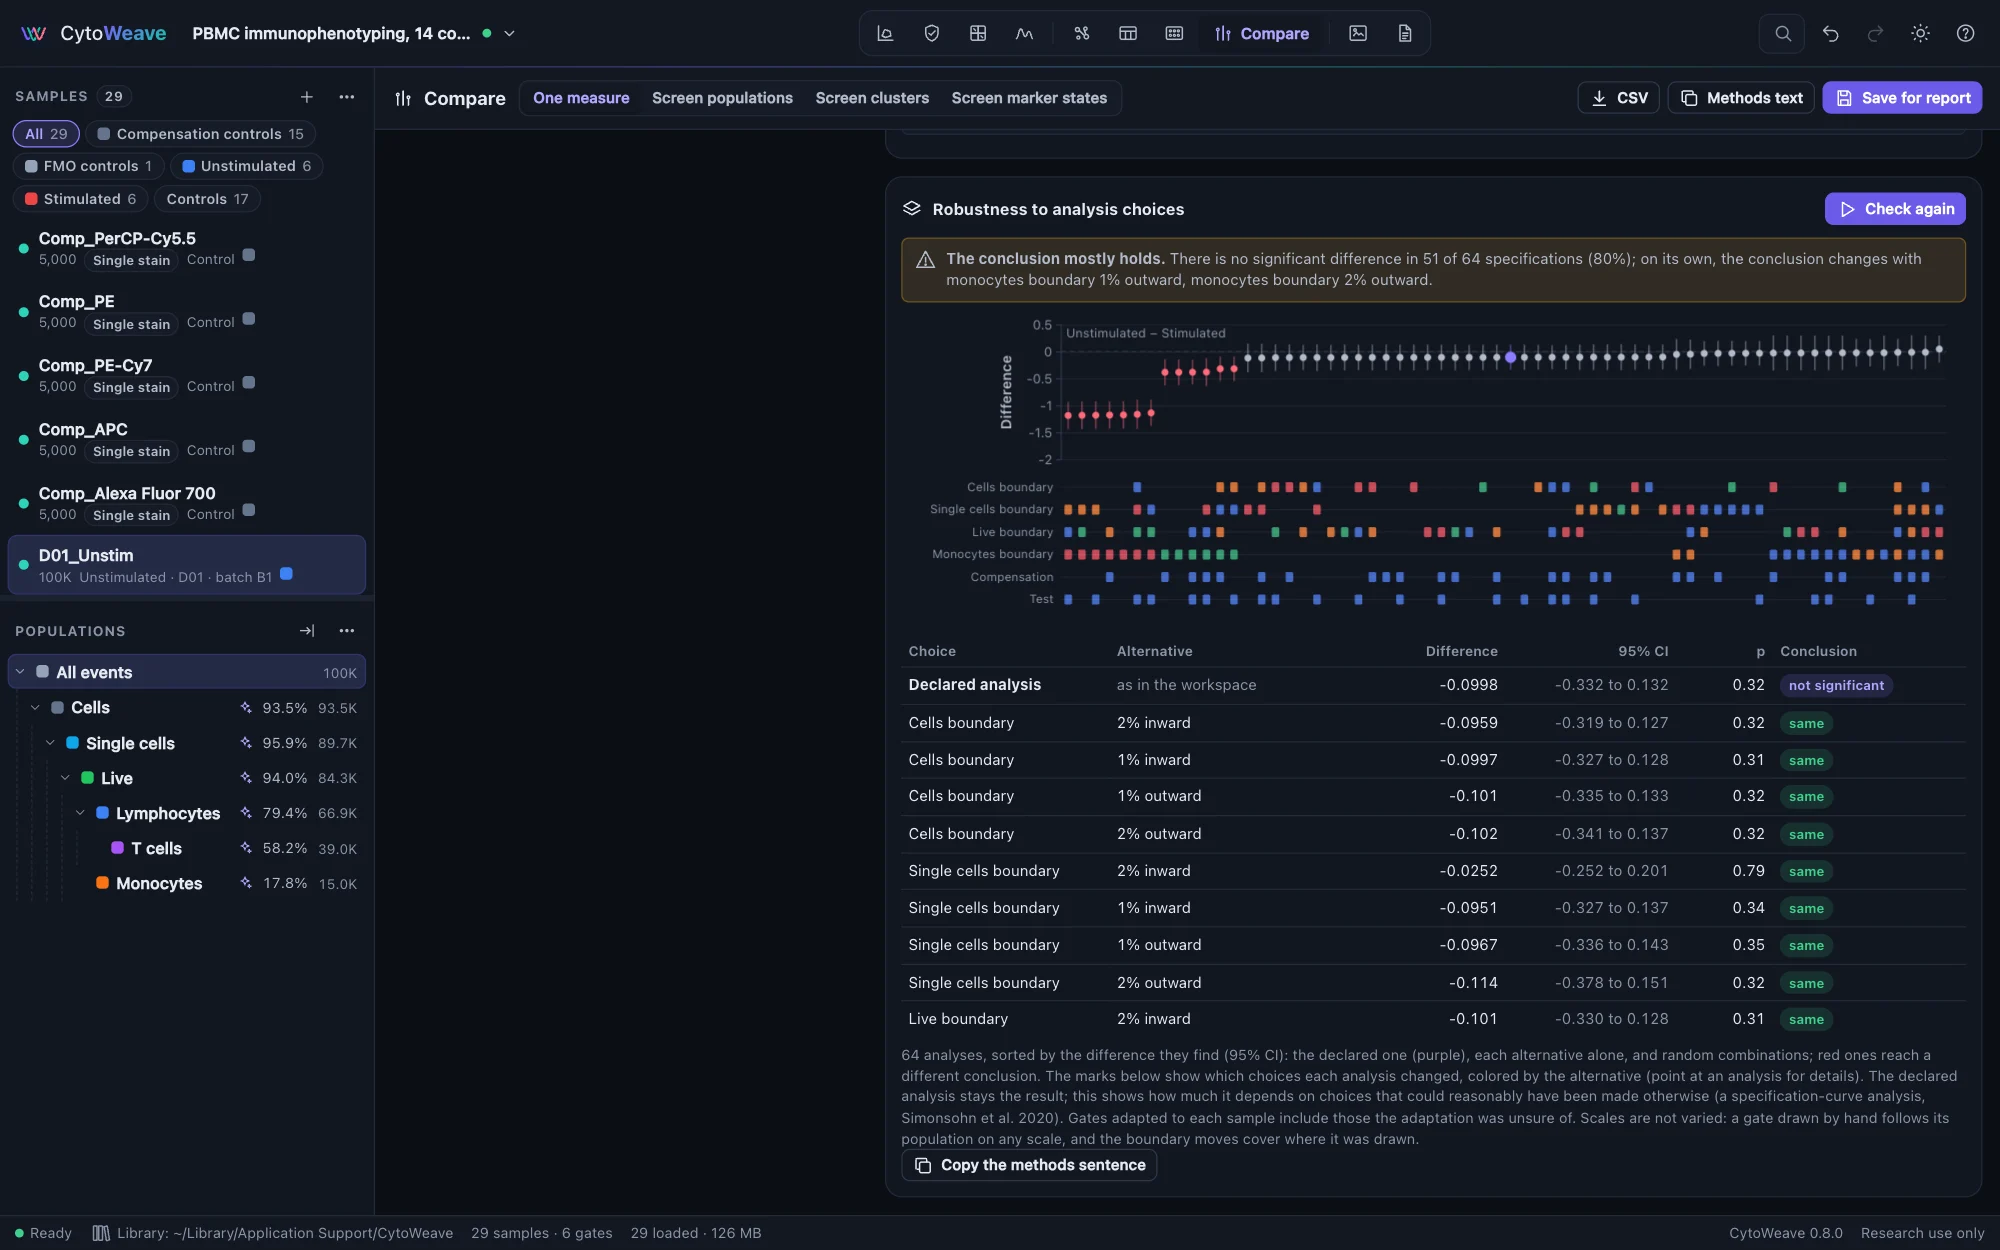
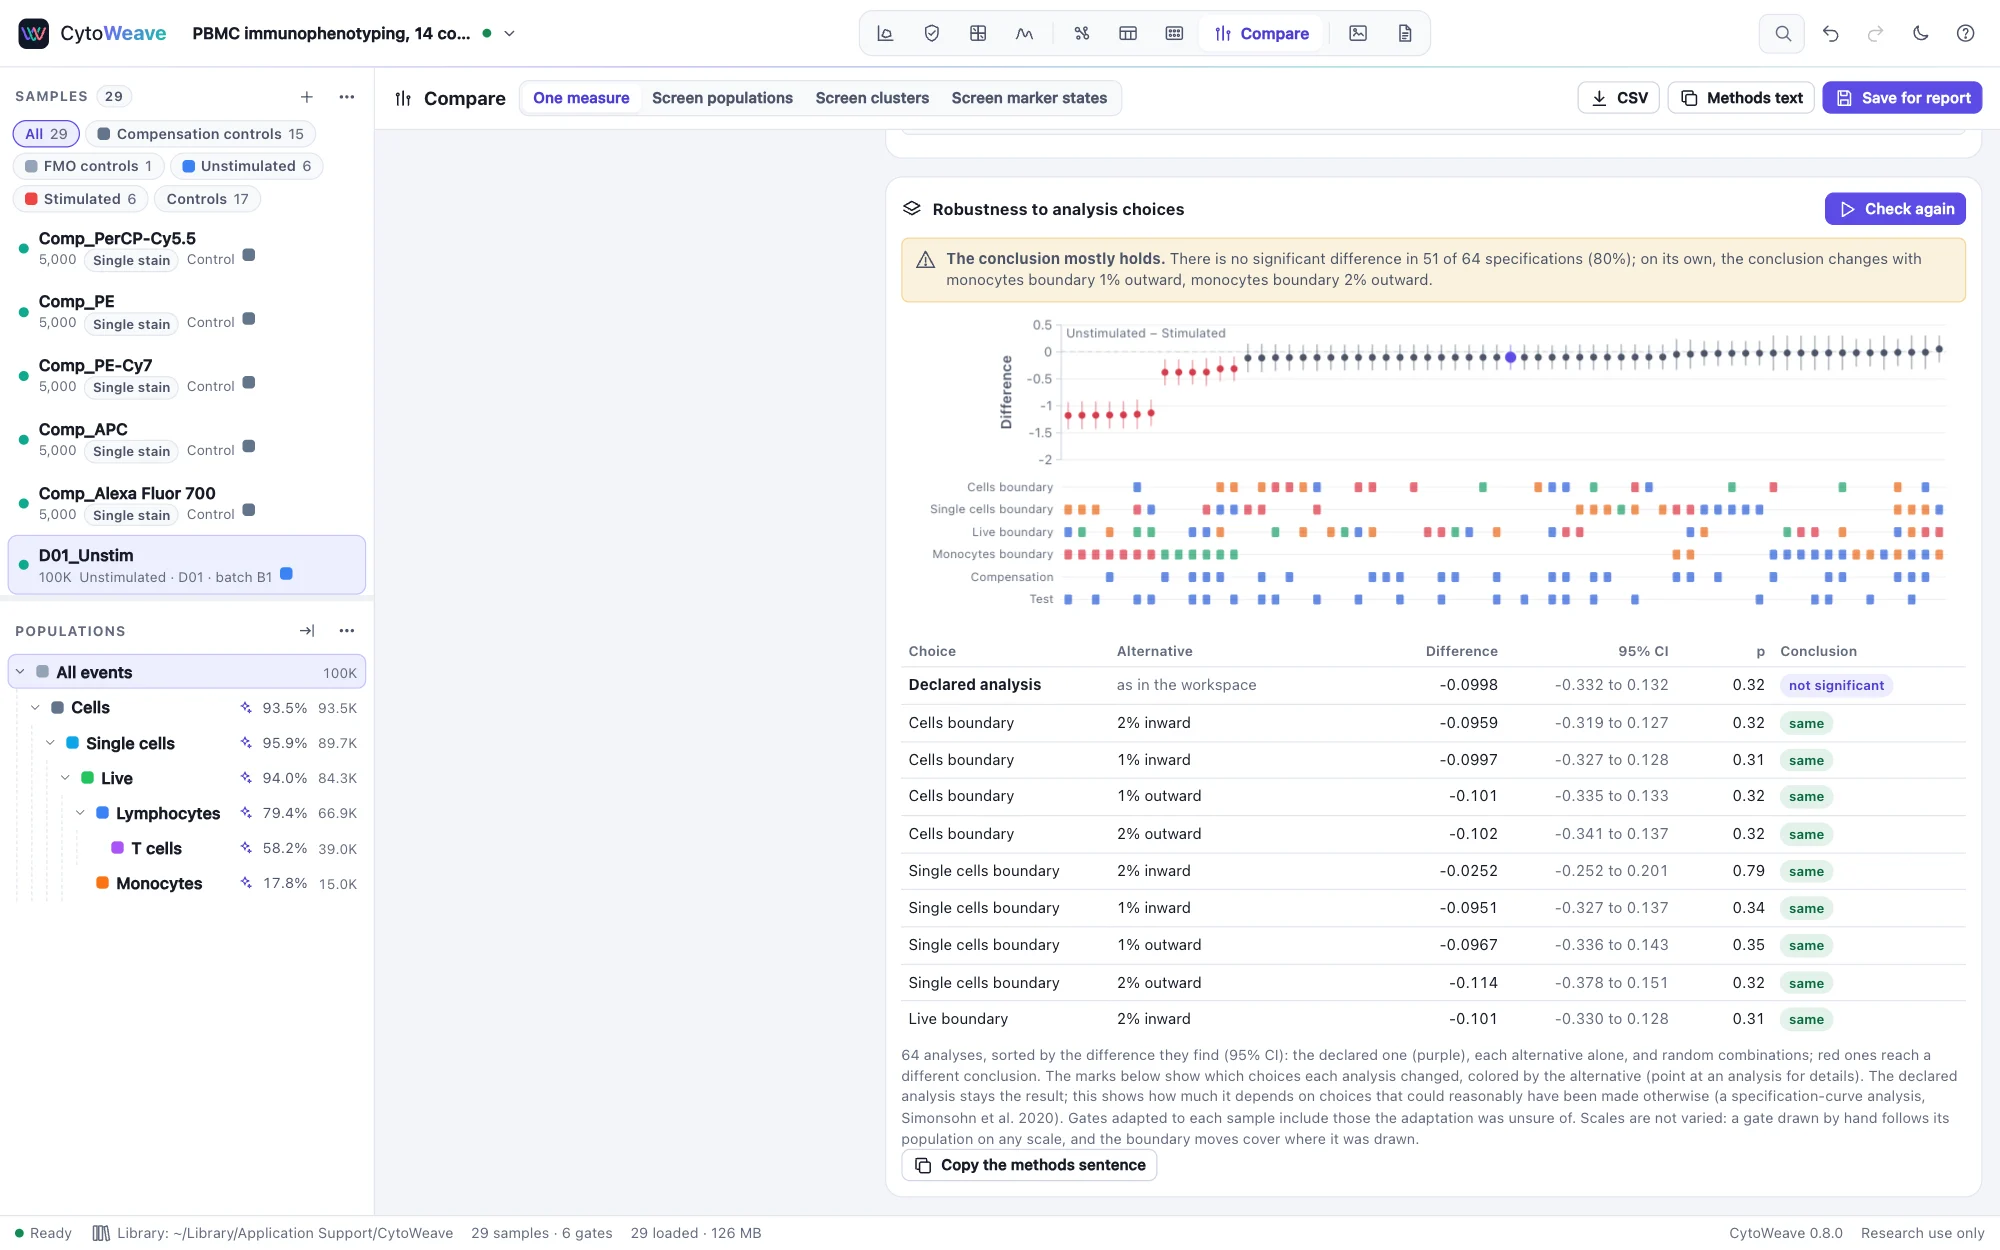
Robustness to analysis choices for monocytes, stimulated against unstimulated: the conclusion mostly holds, with a specification curve of 64 analyses, those drawn with a wider monocyte gate in redRobustness to analysis choices for monocytes, stimulated against unstimulated: the conclusion mostly holds, with a specification curve of 64 analyses, those drawn with a wider monocyte gate in red
Monocytes do not change with stimulation, unless the monocyte gate is drawn wider: activated T cells then fall into it.
Differential state

Which markers change, in which cells

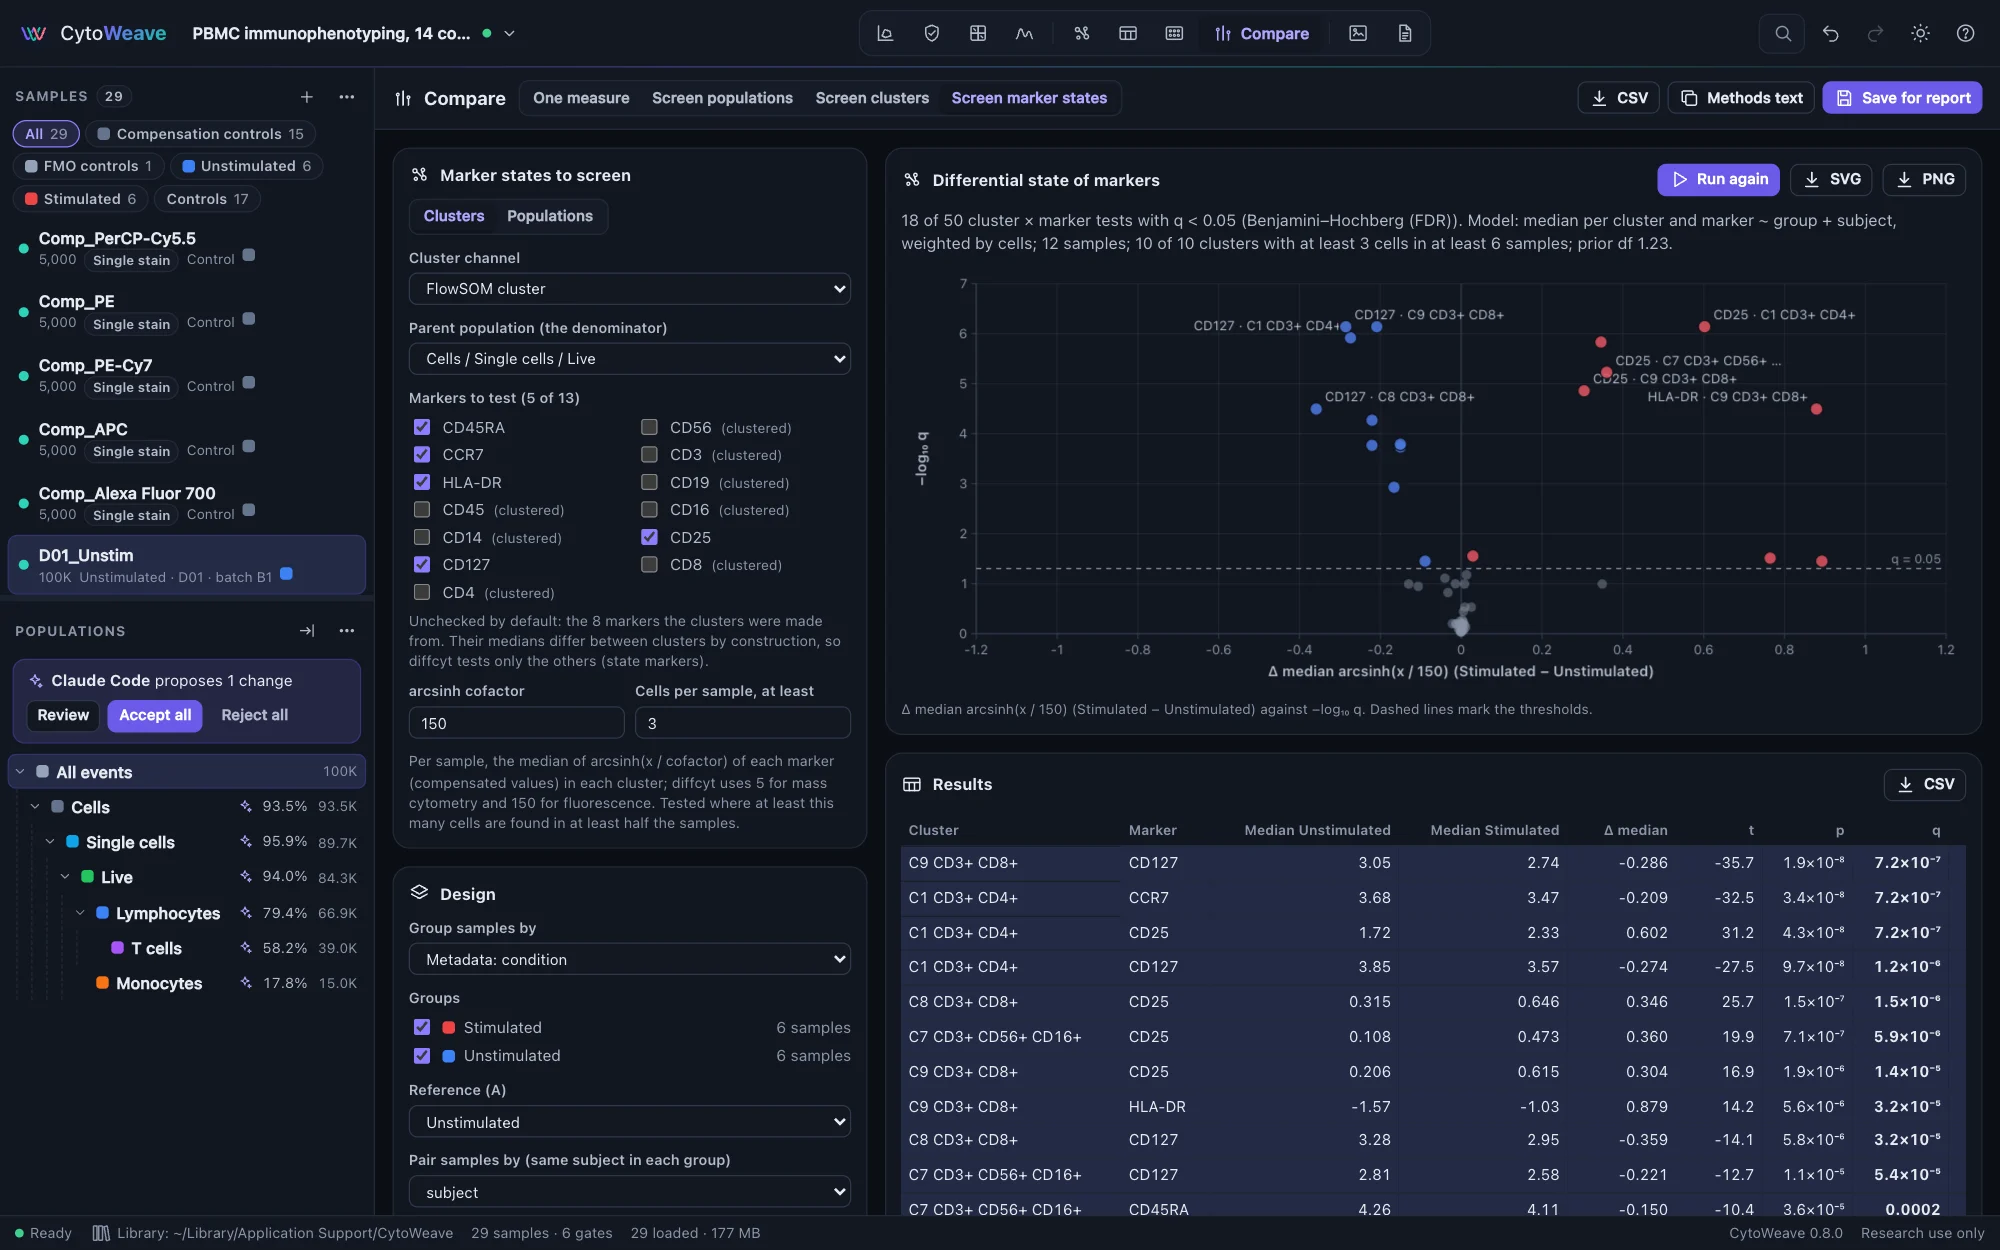
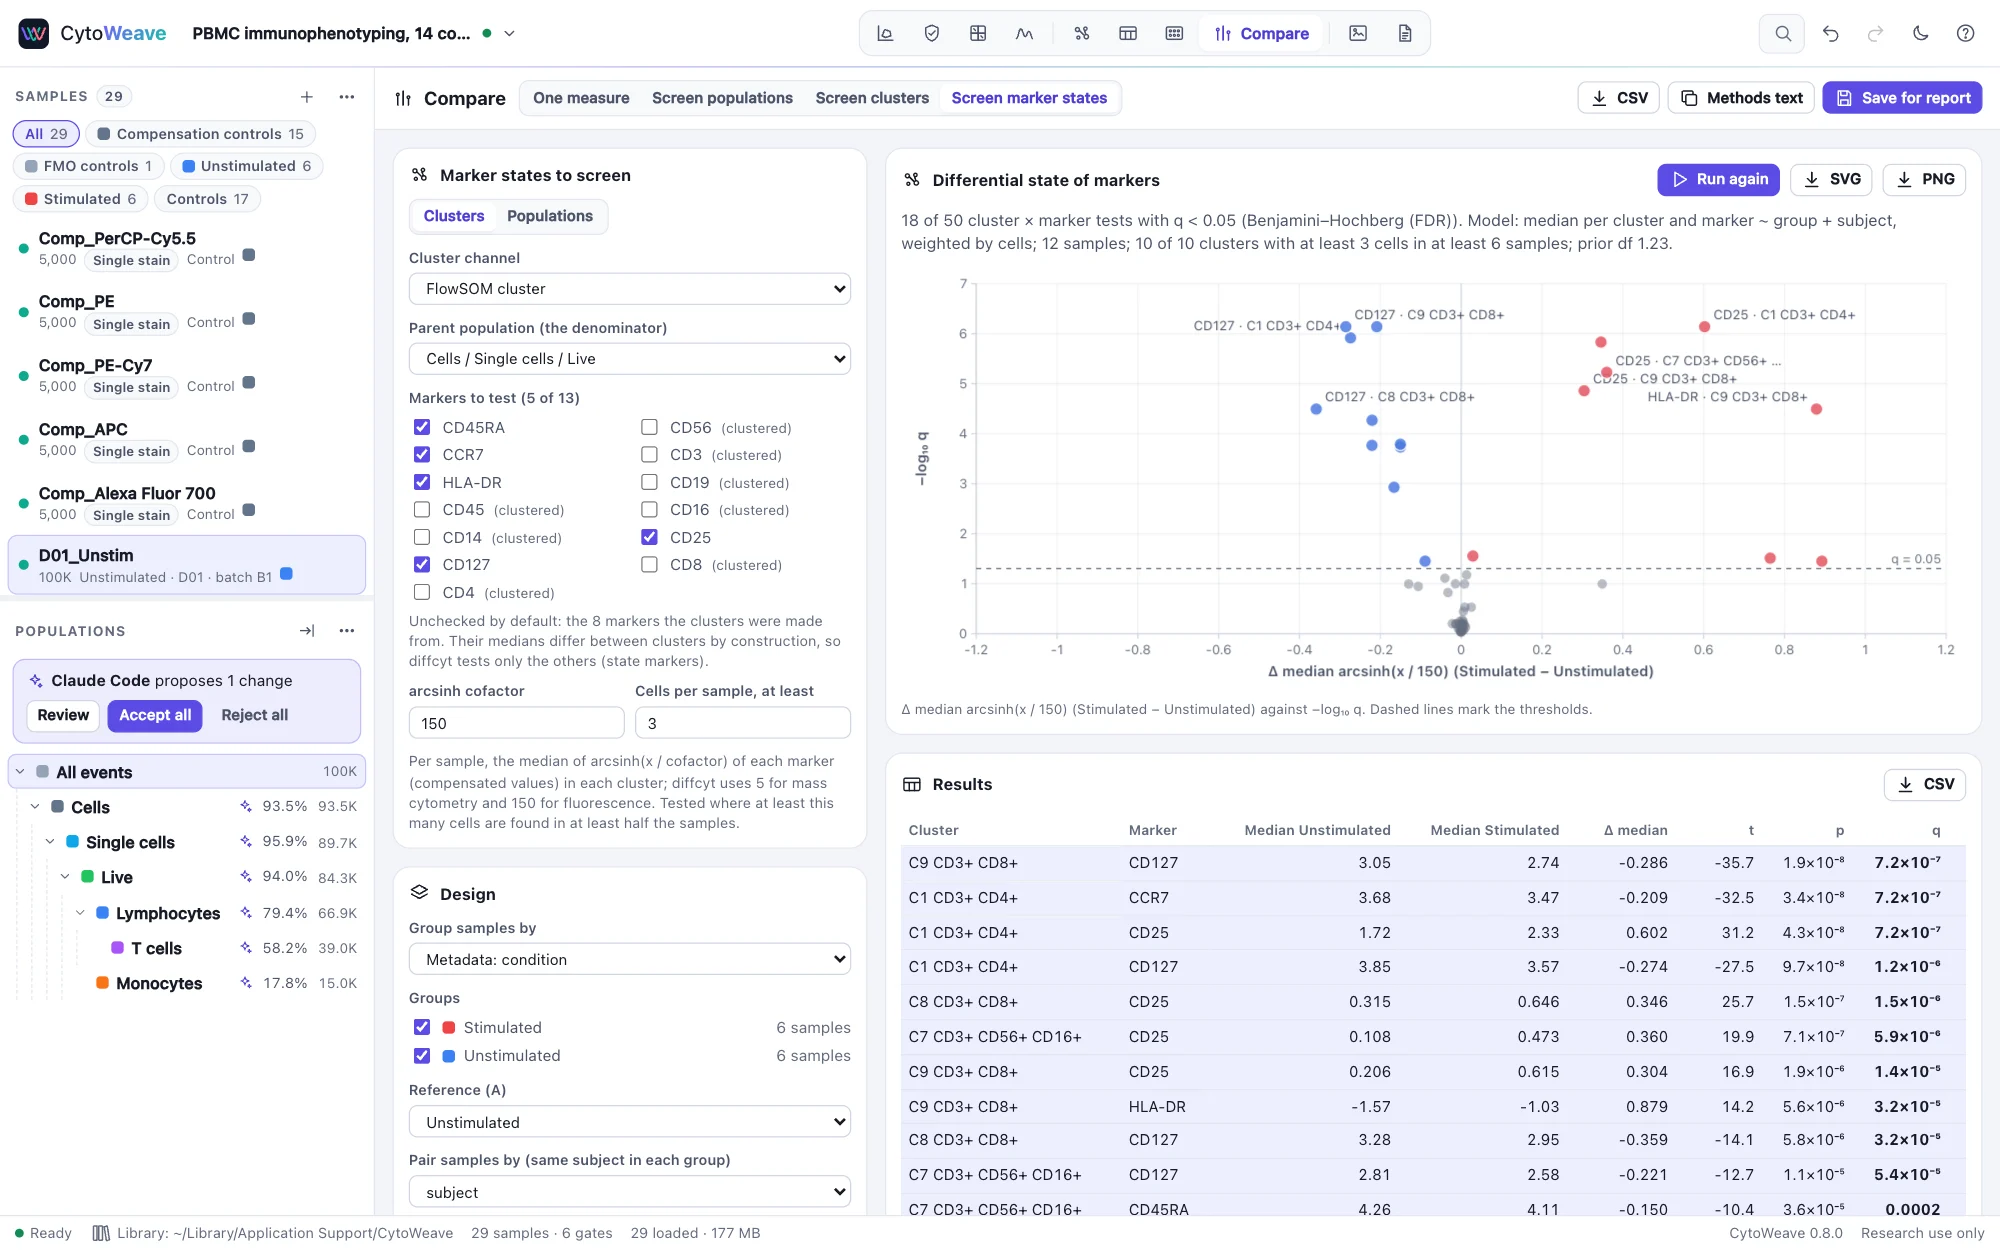
A cell type can keep its frequency while its cells change. Screen every cluster or population for markers whose level differs between conditions with diffcyt-DS-limma: each sample's median per cluster and marker, a model of the design with pairing and covariates, and limma's moderated t-statistics. CytoWeave computes them itself, and gives the same numbers as diffcyt and limma in R.

  • Differential abundance of every cluster beside it
  • The markers the clusters were made from left out by default
  • Every test equal to R's within 3e-11 on the mass cytometry examples
Differential state
Screen marker states: FlowSOM clusters from lineage markers, activation markers tested between stimulated and unstimulated samples paired by donor; CD25 and HLA-DR up and CD127 down in the T-cell clustersScreen marker states: FlowSOM clusters from lineage markers, activation markers tested between stimulated and unstimulated samples paired by donor; CD25 and HLA-DR up and CD127 down in the T-cell clusters
Activation markers in clusters of lineage markers: stimulation raises CD25 and HLA-DR and lowers CD127 in the T-cell clusters.
AI agents

Let an agent run the analysis while you watch, then decide

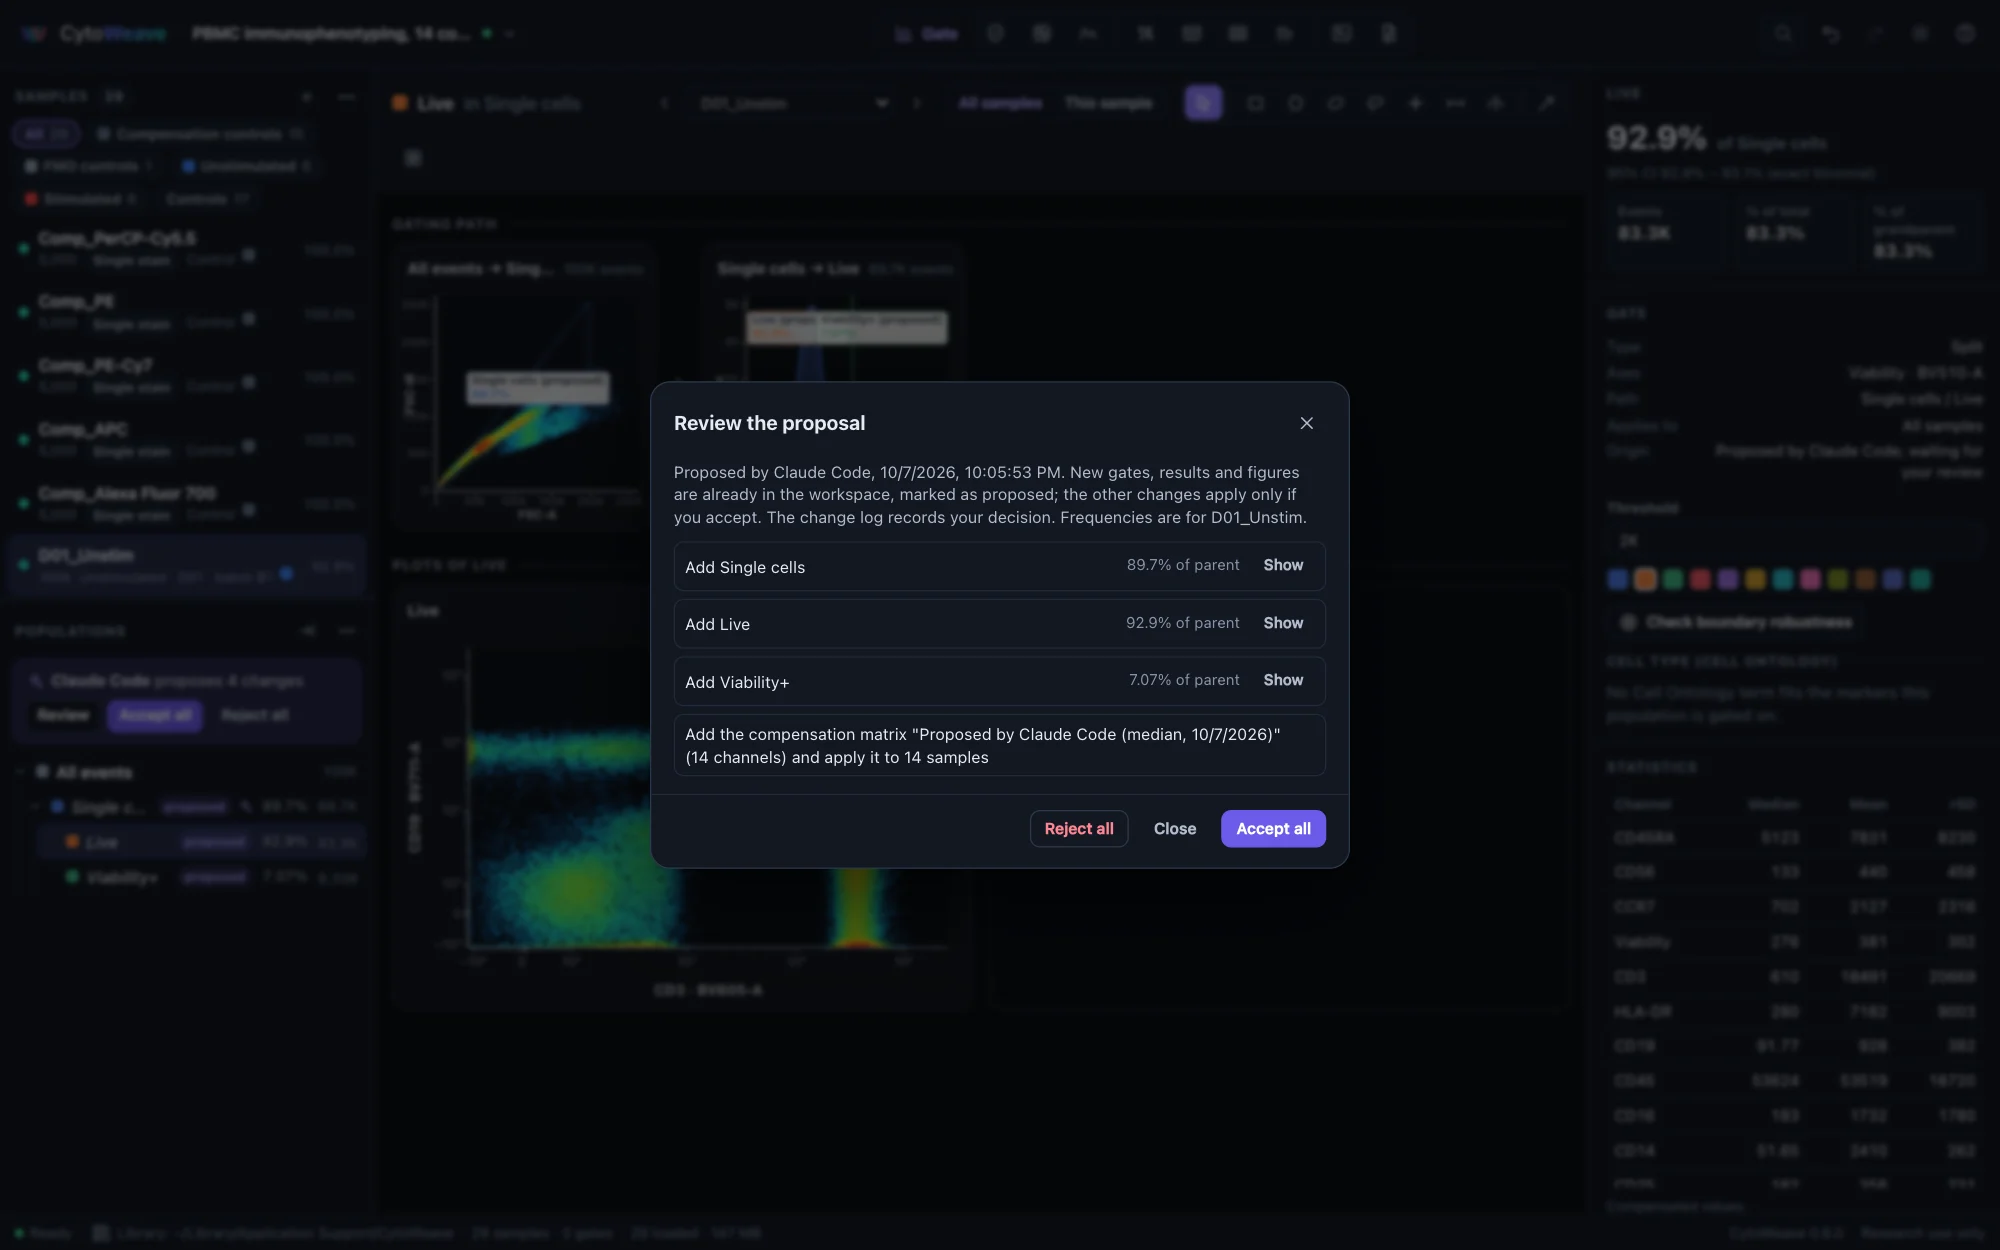
CytoWeave is an MCP server, so Claude Code and other agents can run the whole analysis in the window you are watching: annotate samples, gate, run QC, unmix, cluster and map, compare groups and test differential state, apply templates and published strategies, analyze titrations, build figures and batch reports, write the methods and export FlowJo workspaces, tables and events. Their changes arrive as proposals: new gates, results and figures appear marked as proposed with real counts, and renames, deletions, annotations and compensation matrices wait for you.

  • Accept or reject the whole proposal from one strip
  • The change log records which agent proposed what
  • Every change can be undone
AI agents (MCP)
Review the proposal: Claude Code proposes three gates with their frequencies and a compensation matrix for 12 samples, with Reject all and Accept all buttonsReview the proposal: Claude Code proposes three gates with their frequencies and a compensation matrix for 12 samples, with Reject all and Accept all buttons
Claude Code proposes single cells, live cells and a compensation matrix; nothing is final until you accept.
R and Python

Your analysis, from R, Python and scanpy

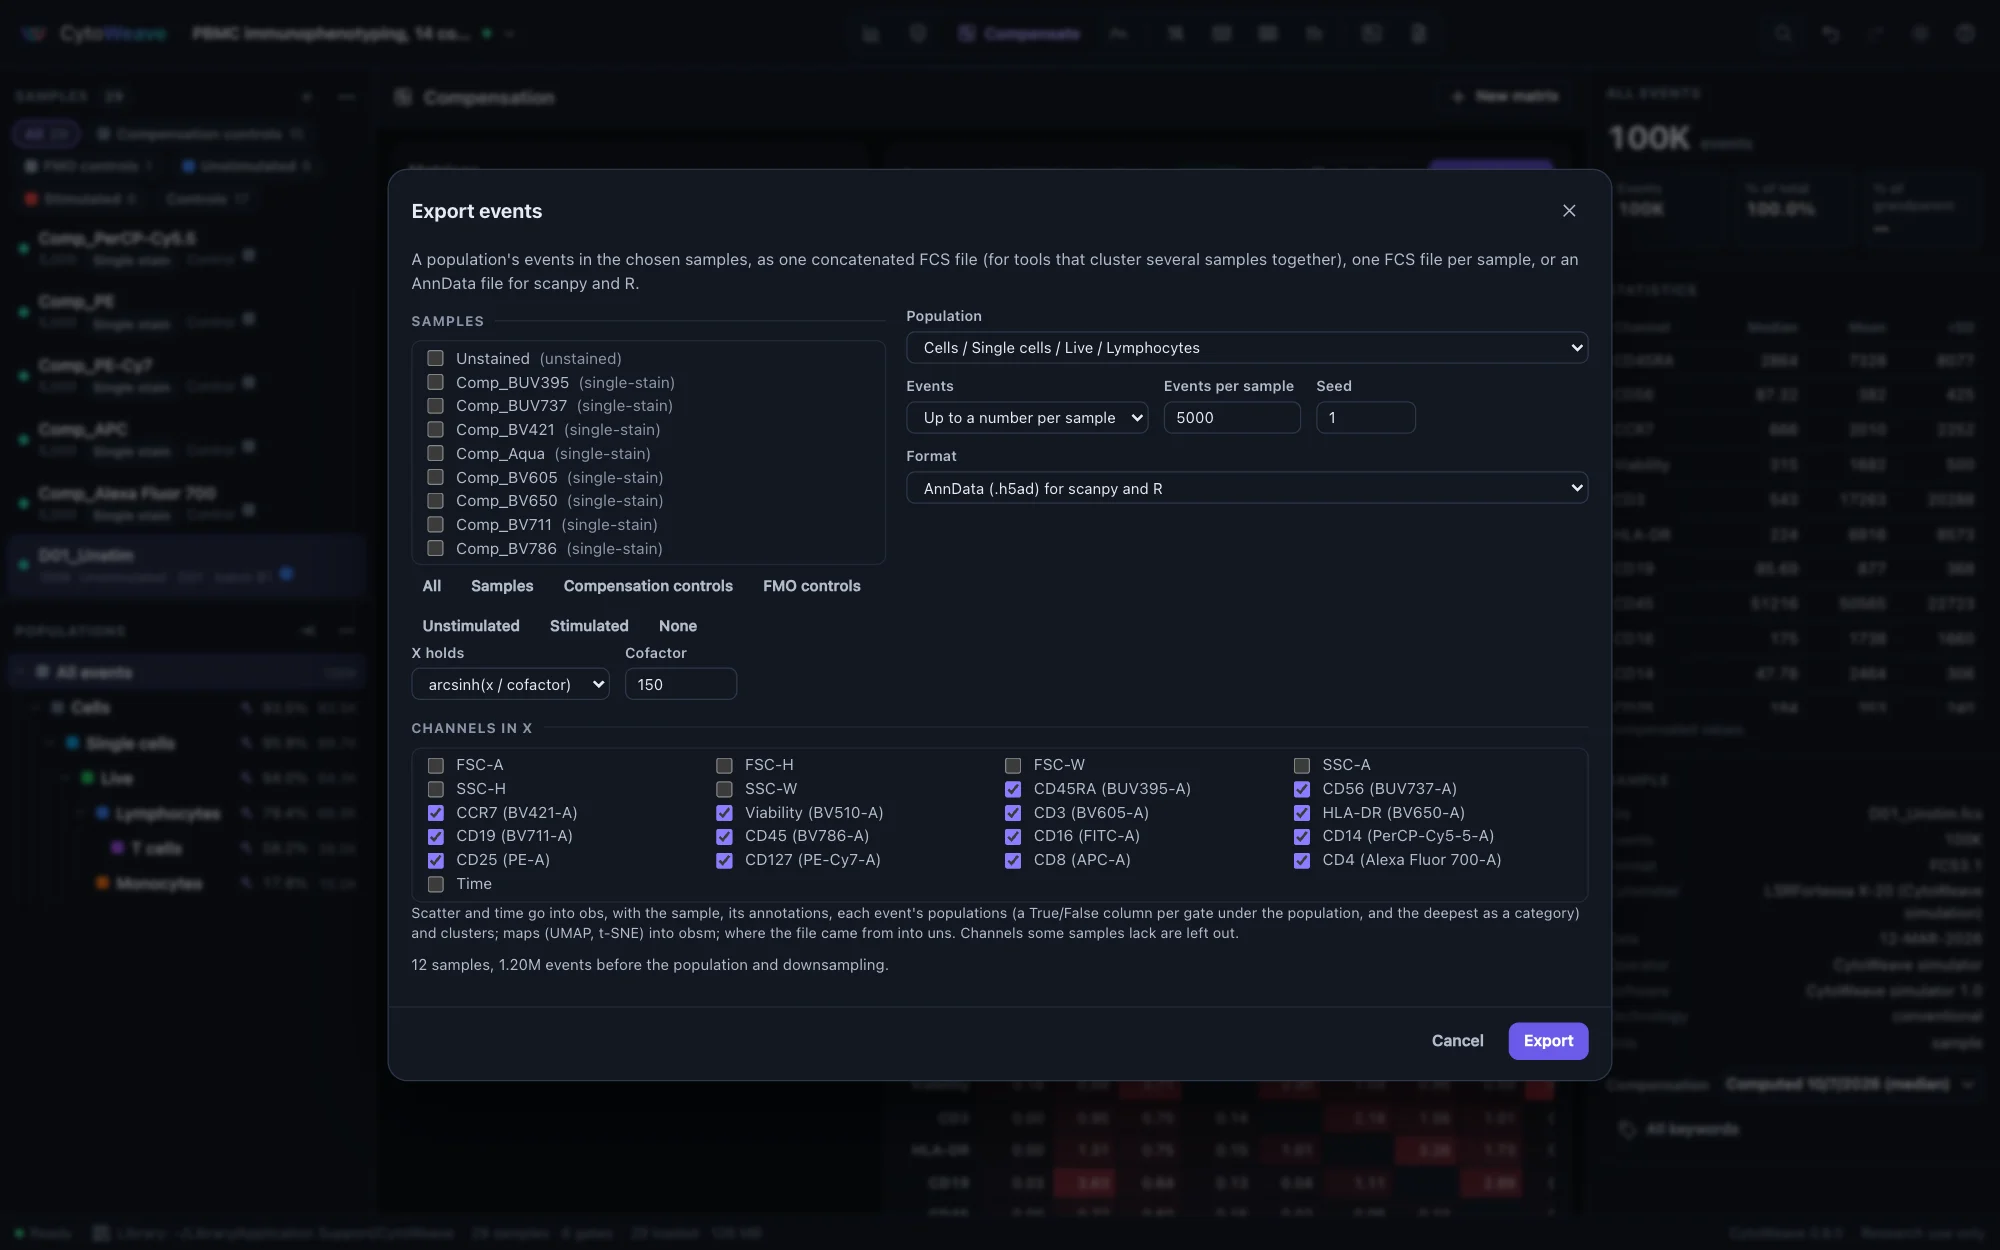
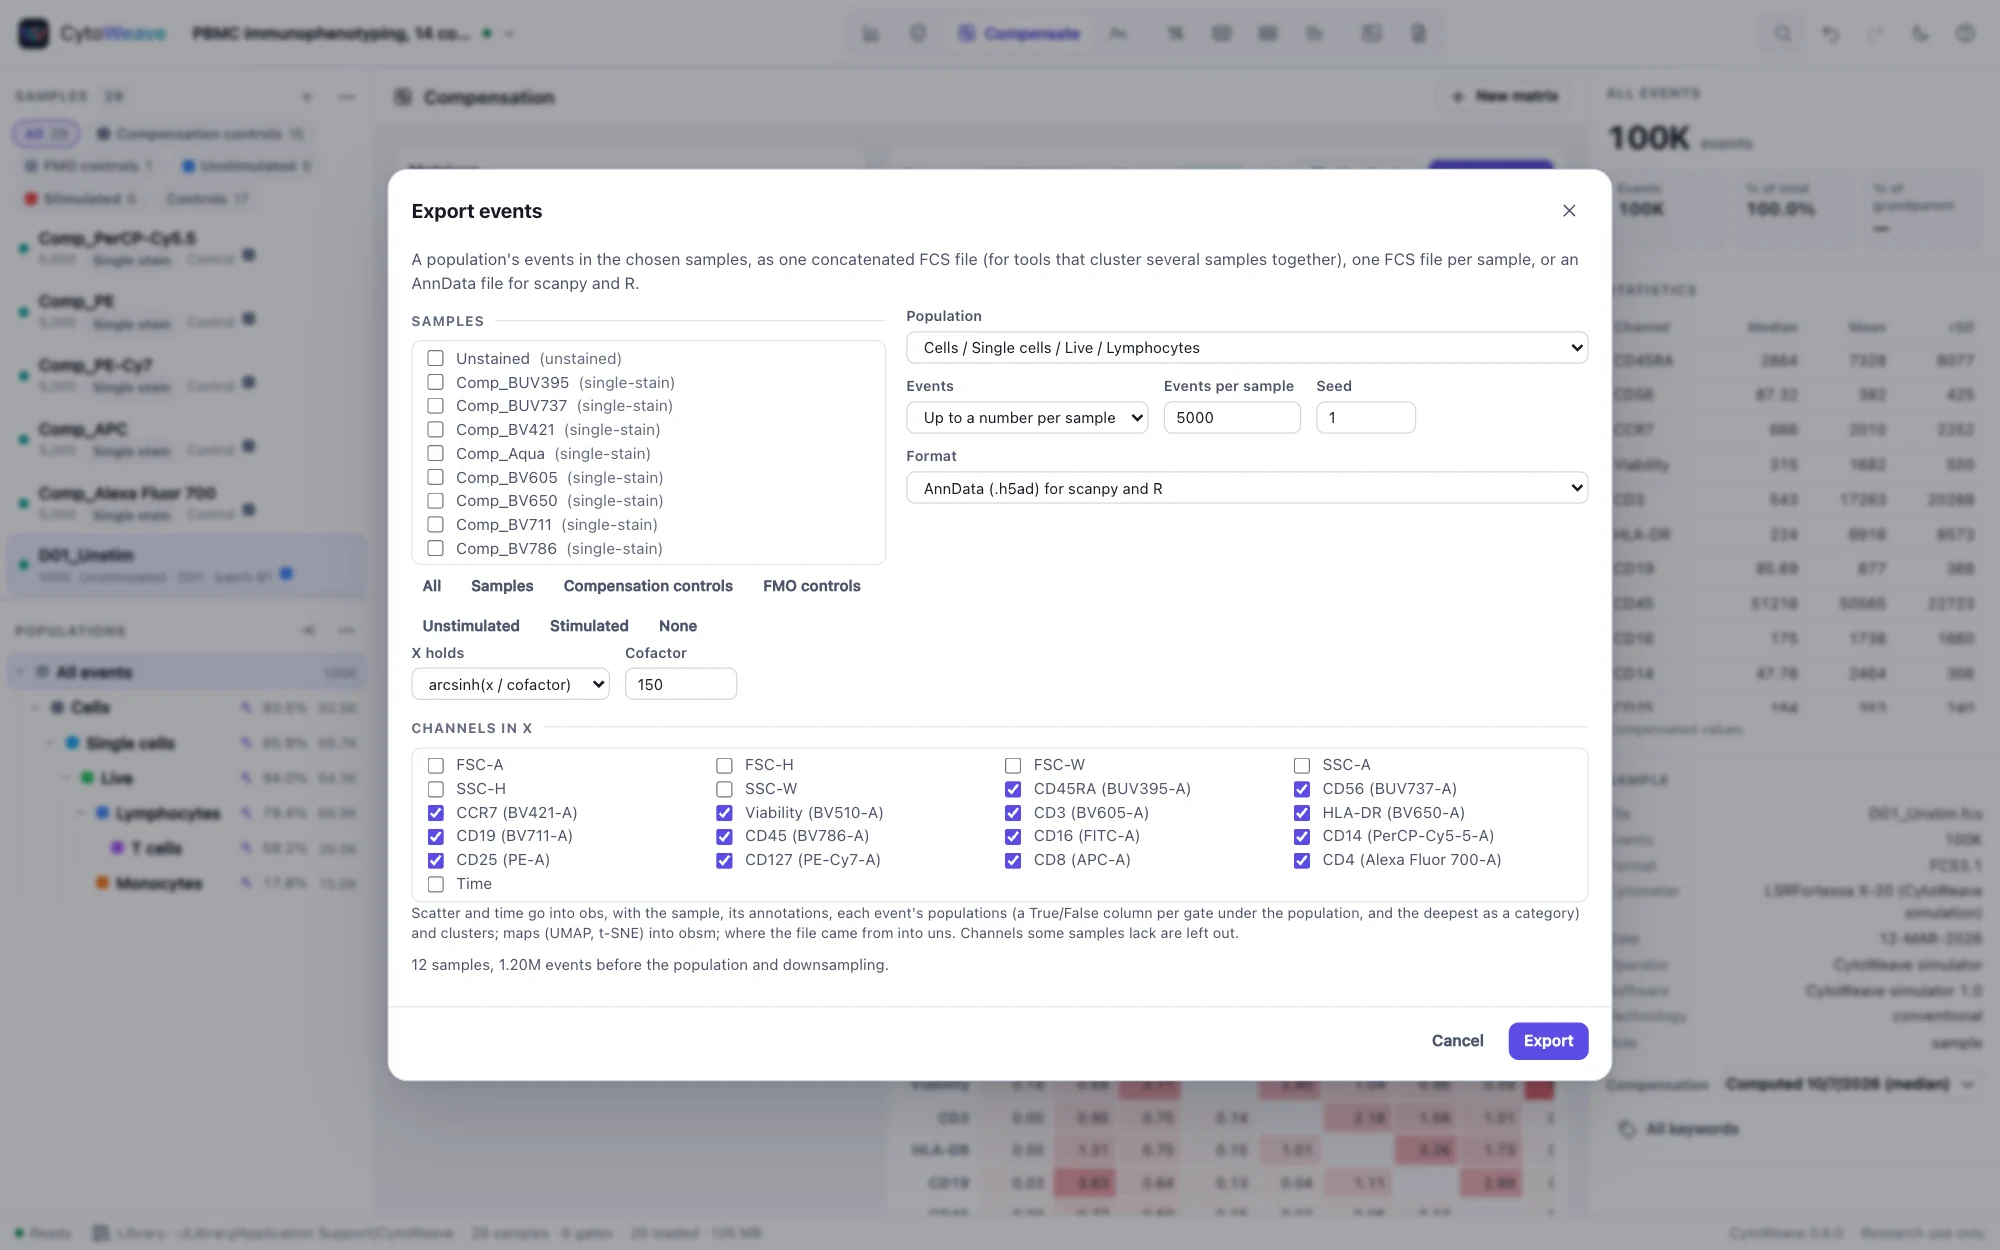
Every action an agent has is a function in CytoWeave's R and Python clients, which find the running program themselves, so a script can open a plate, apply the gating and pull the statistics into a data frame while you watch it work in the window. Events go out as one concatenated FCS file, downsampled with a seed, or as AnnData for scanpy, with every population, cluster and annotation; CSV files of events come in with every column checked.

  • Results as data frames; plots saved as PNG
  • AnnData read exactly by anndata, h5py and pyfive
  • Each event of a concatenated file traceable to its sample and index
R and Python clients
Export events: the lymphocytes of 12 samples, up to 5,000 per sample with a seed, as an AnnData file with arcsinh-transformed marker channels in XExport events: the lymphocytes of 12 samples, up to 5,000 per sample with a seed, as an AnnData file with arcsinh-transformed marker channels in X
The lymphocytes of every sample, 5,000 each with a seed, as AnnData for scanpy.
Plates

A plate at a glance: heat maps, Z′, dose-response and bead assays

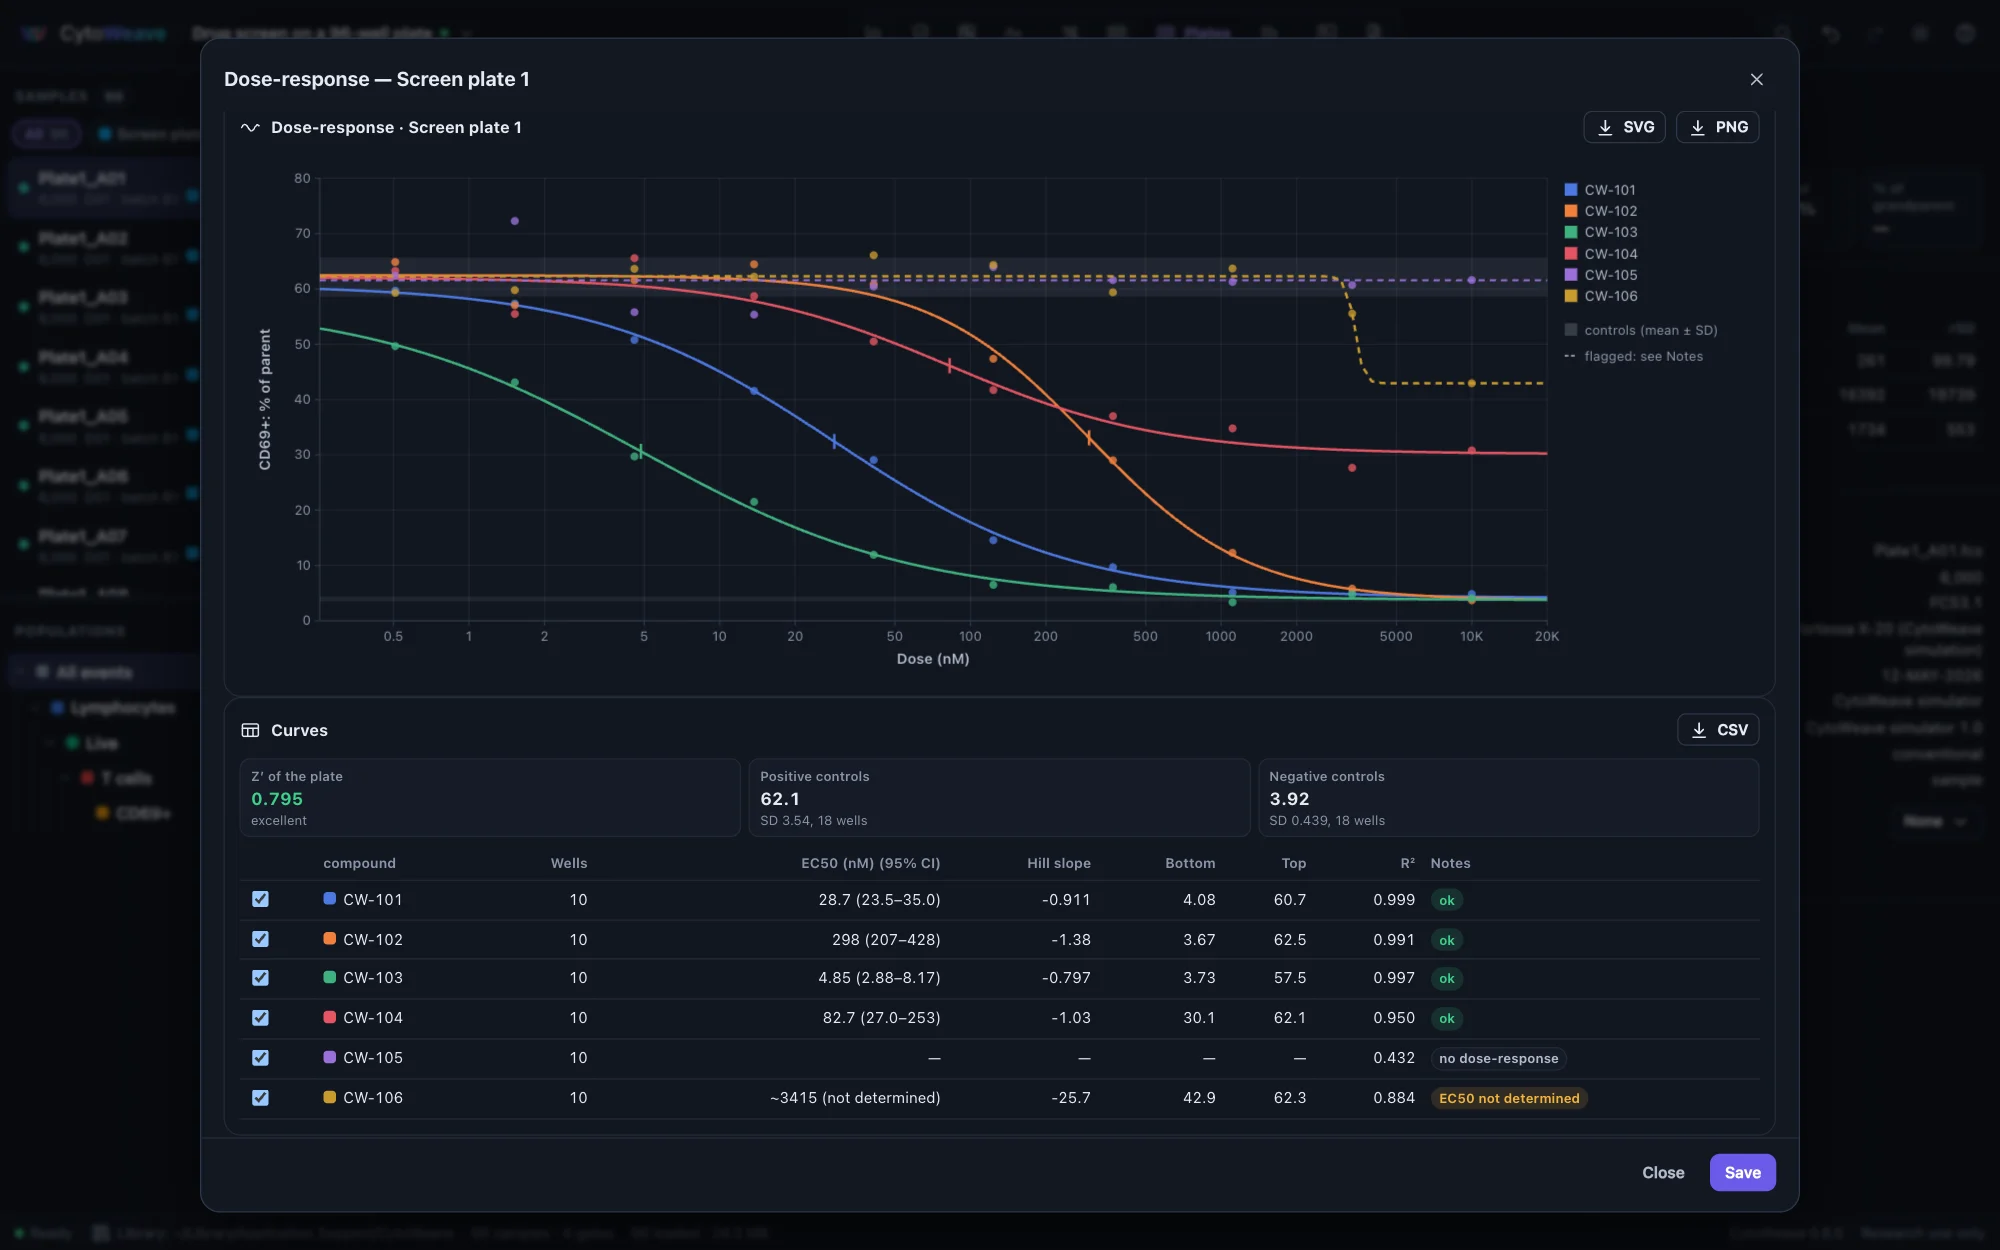
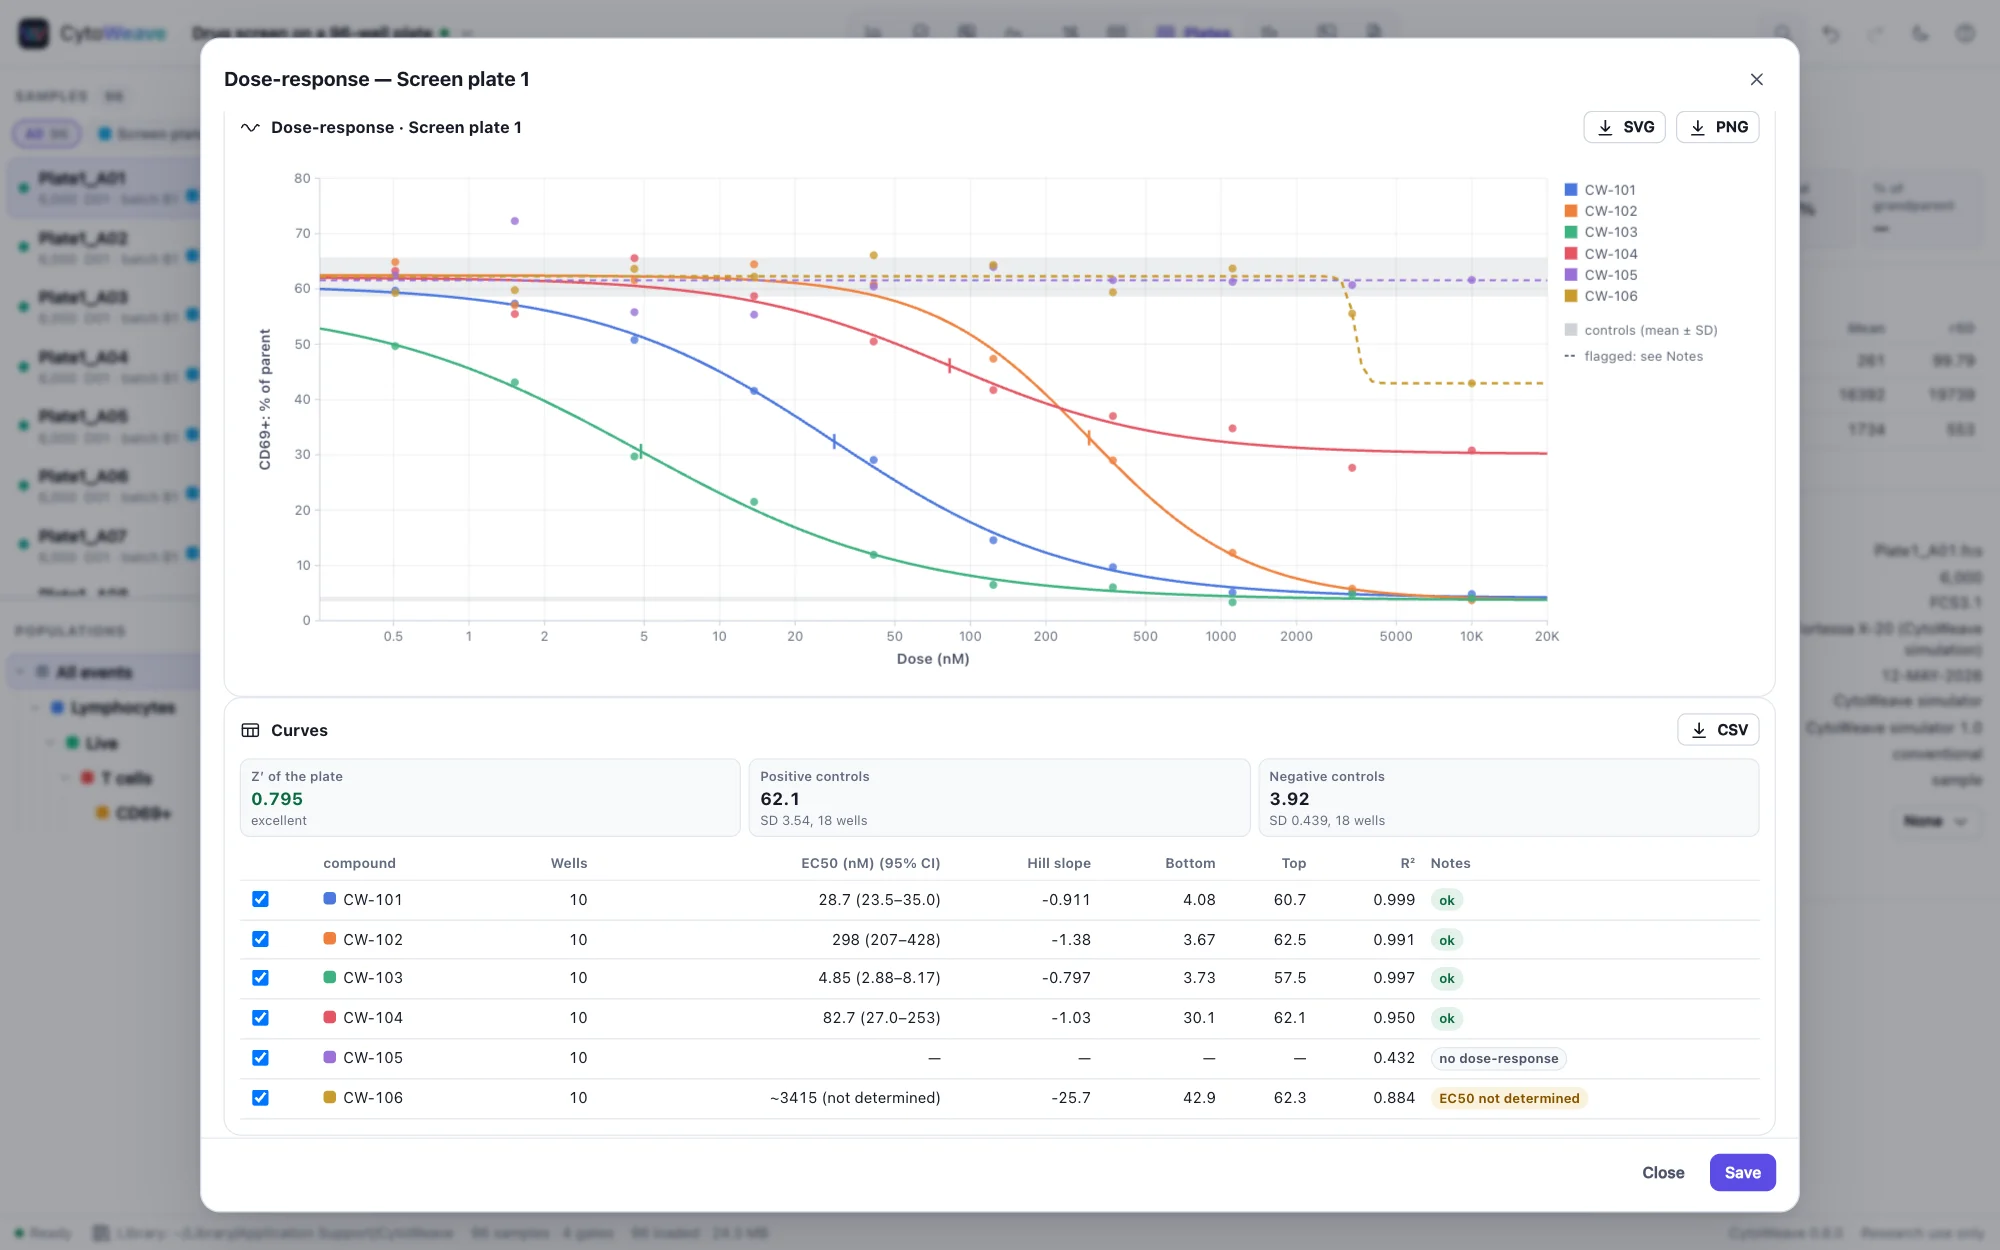
Samples acquired from a plate are placed in their wells from their keywords or names. Lay out the plate (compounds and doses, controls, standards) or import the layout, and show any statistic across it with the screen's Z′. Fit each compound's dose-response curve with its EC50 and confidence interval, and read a LEGENDplex or CBA bead assay against its standard curves, with each analyte's quantifiable range.

  • Four- and five-parameter curves never worse than R's drc on the same data
  • Bead identification identical to beadplexr's on its own LEGENDplex files
  • cytoweave run applies a template to a folder of files without a window, for nightly runs and CI
Plates, dose-response and bead assays
Dose-response curves of six compounds on a 96-well screen: four inhibitors with fitted curves, a partial one, an inactive one dashed flat and one whose IC50 lies beyond the doses dashed, with EC50s and their confidence intervalsDose-response curves of six compounds on a 96-well screen: four inhibitors with fitted curves, a partial one, an inactive one dashed flat and one whose IC50 lies beyond the doses dashed, with EC50s and their confidence intervals
Six compounds of the drug-screen example, with the plate's Z′ from its control wells.
Moving from FlowJo

Bring your FlowJo workspaces, and see that they match

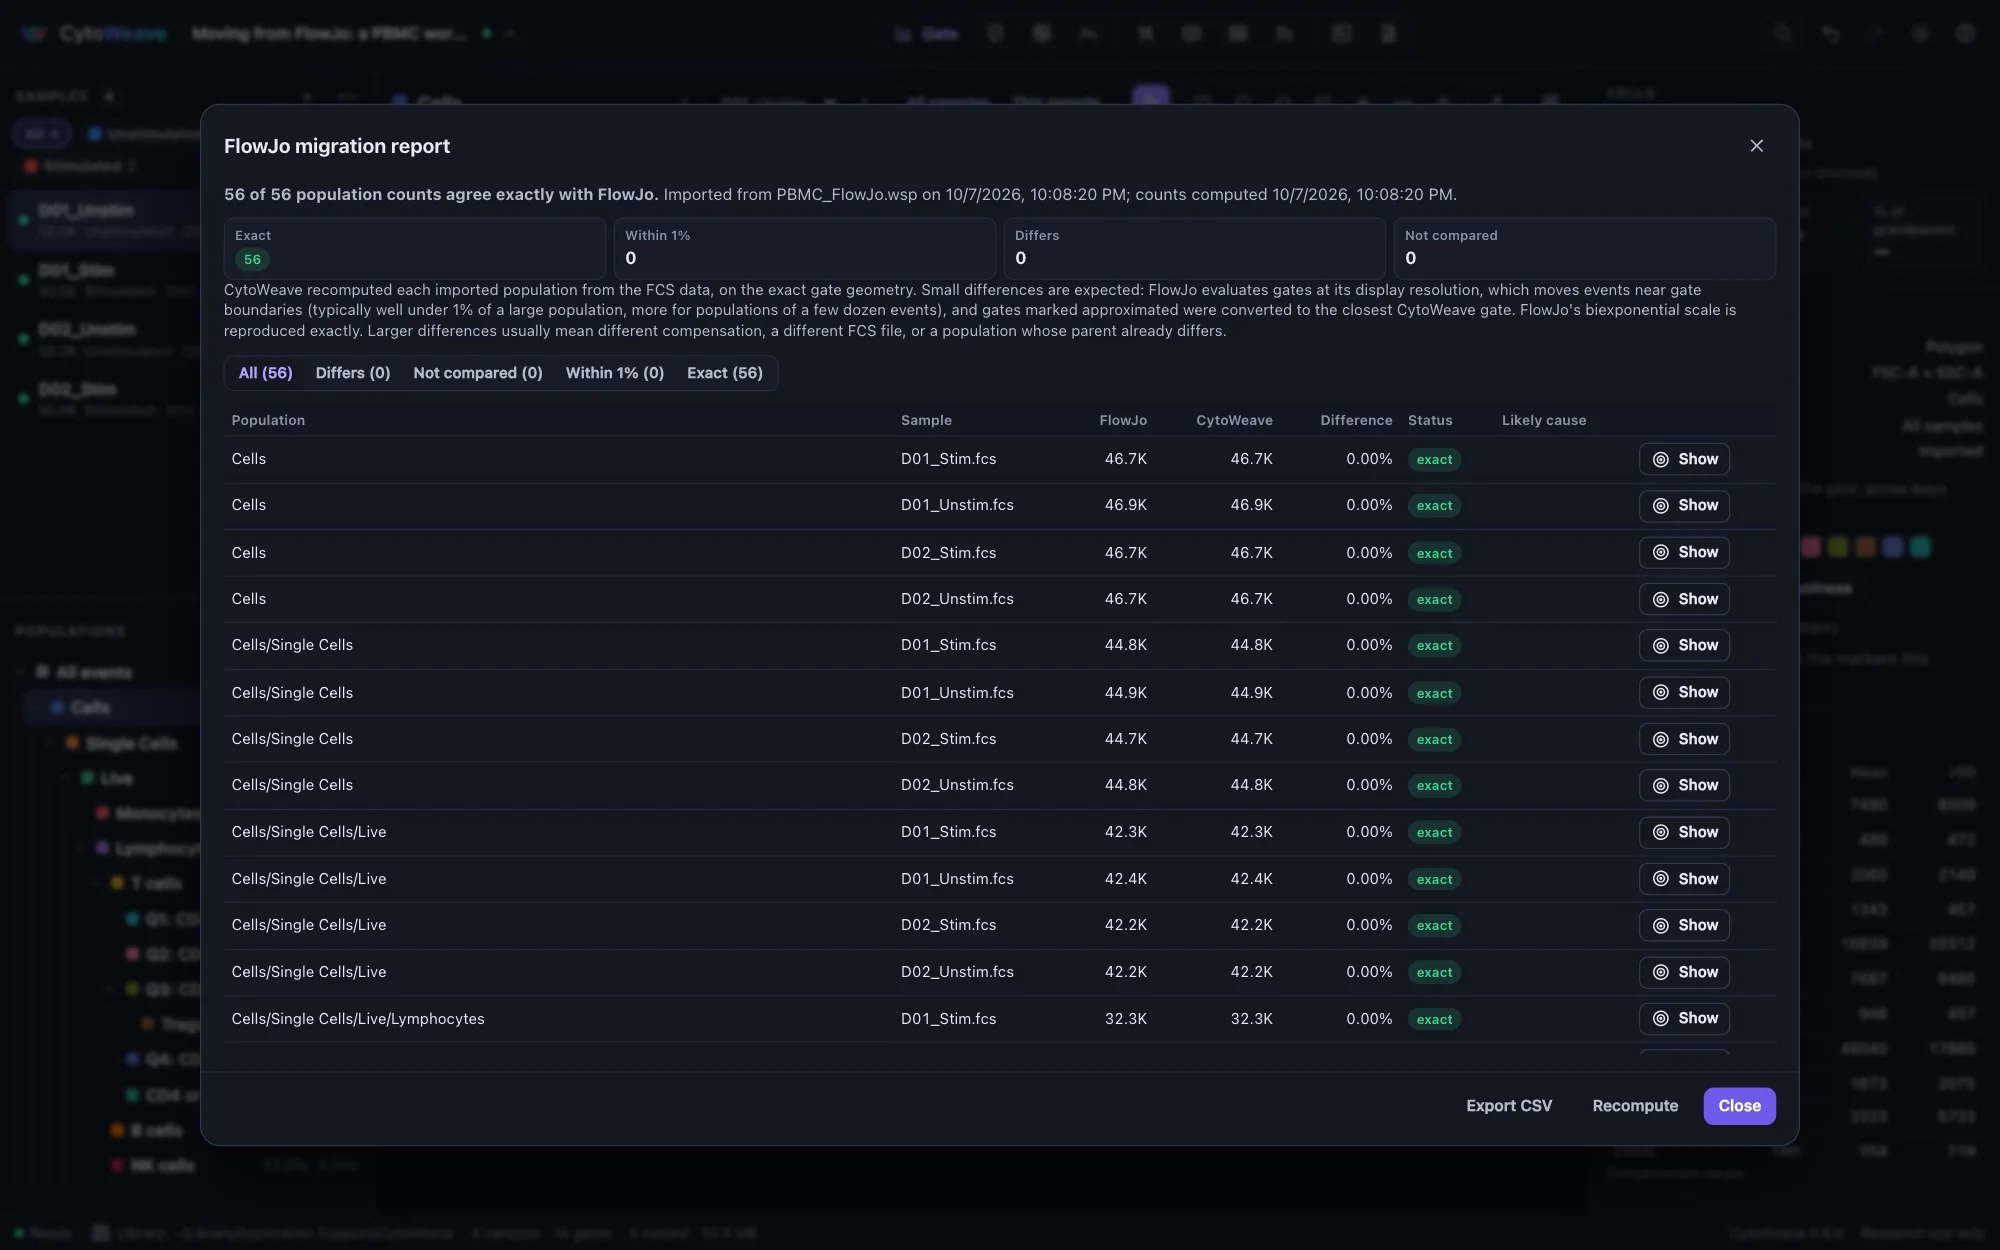
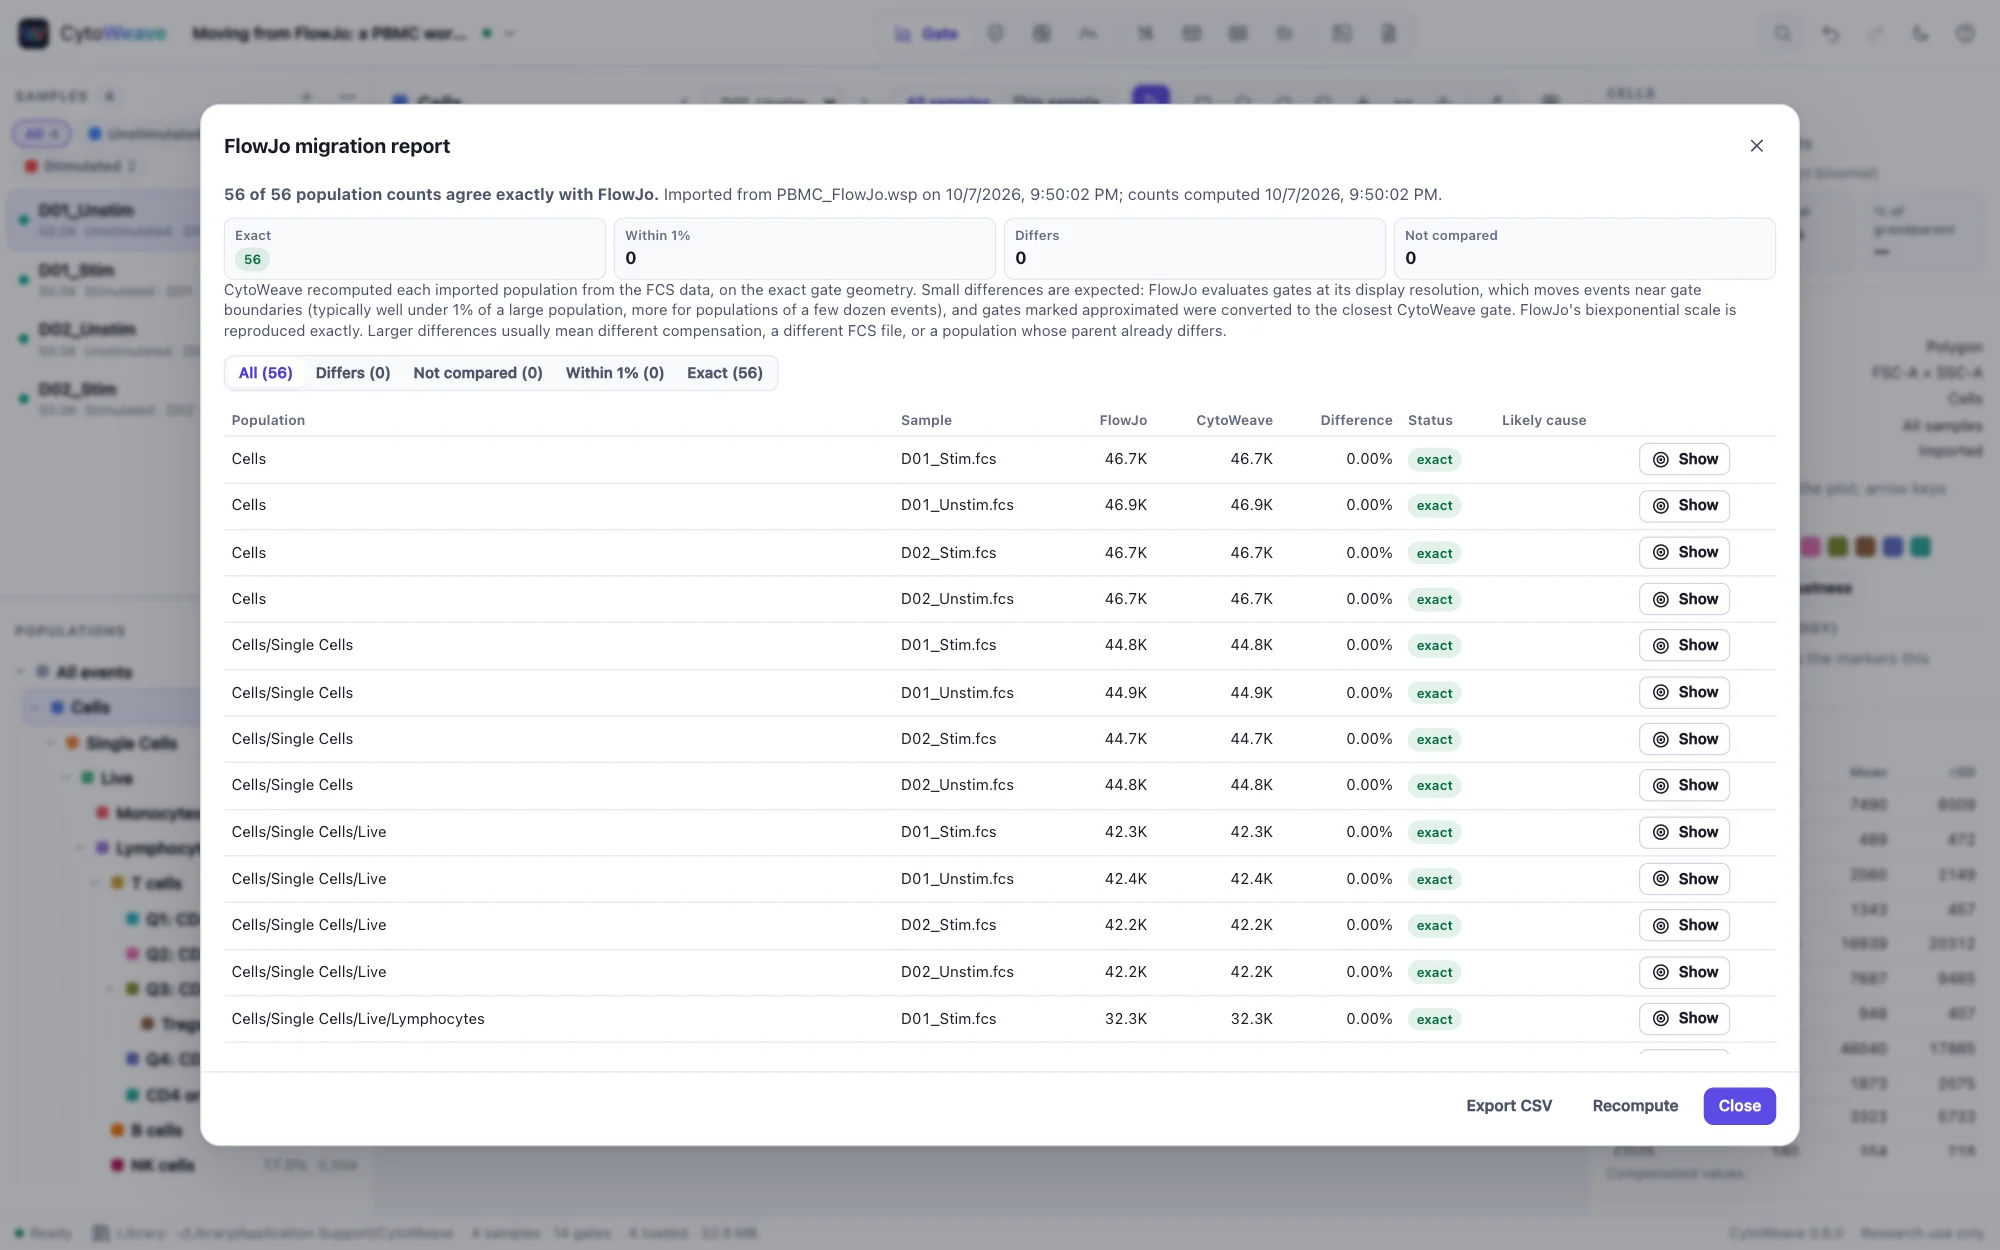
FlowJo 10 workspaces and FlowJo 11 workbenches import with their samples, gates, compensation and scales, and so do FACSDiva experiments, the gates FACSChorus records in its files and SpectroFlo's reference controls. The import lists every population as exact, approximated or unsupported, and the migration report compares every population count with the source software's, with the likely cause of any difference.

  • FlowJo 11's own counts reproduced for every population of twelve workbenches
  • FlowJo's biexponential reproduced from its own algorithm
  • Workspaces exported back to FlowJo, one gating tree per sample, tested in FlowJo 11
  • De-identified FCS files for sharing, with the events untouched
  • Gating-ML 2.0 in and out: all 190 compliance gates exact
  • Archival Cytometry Standard containers and CLR
FlowJo, FACSDiva and Gating-ML
The FlowJo migration report: 56 of 56 population counts agree exactly with FlowJo, listed by population and sampleThe FlowJo migration report: 56 of 56 population counts agree exactly with FlowJo, listed by population and sample
The bundled FlowJo workspace: 56 of 56 population counts agree exactly.
Reproducible

Figures, methods and certificates

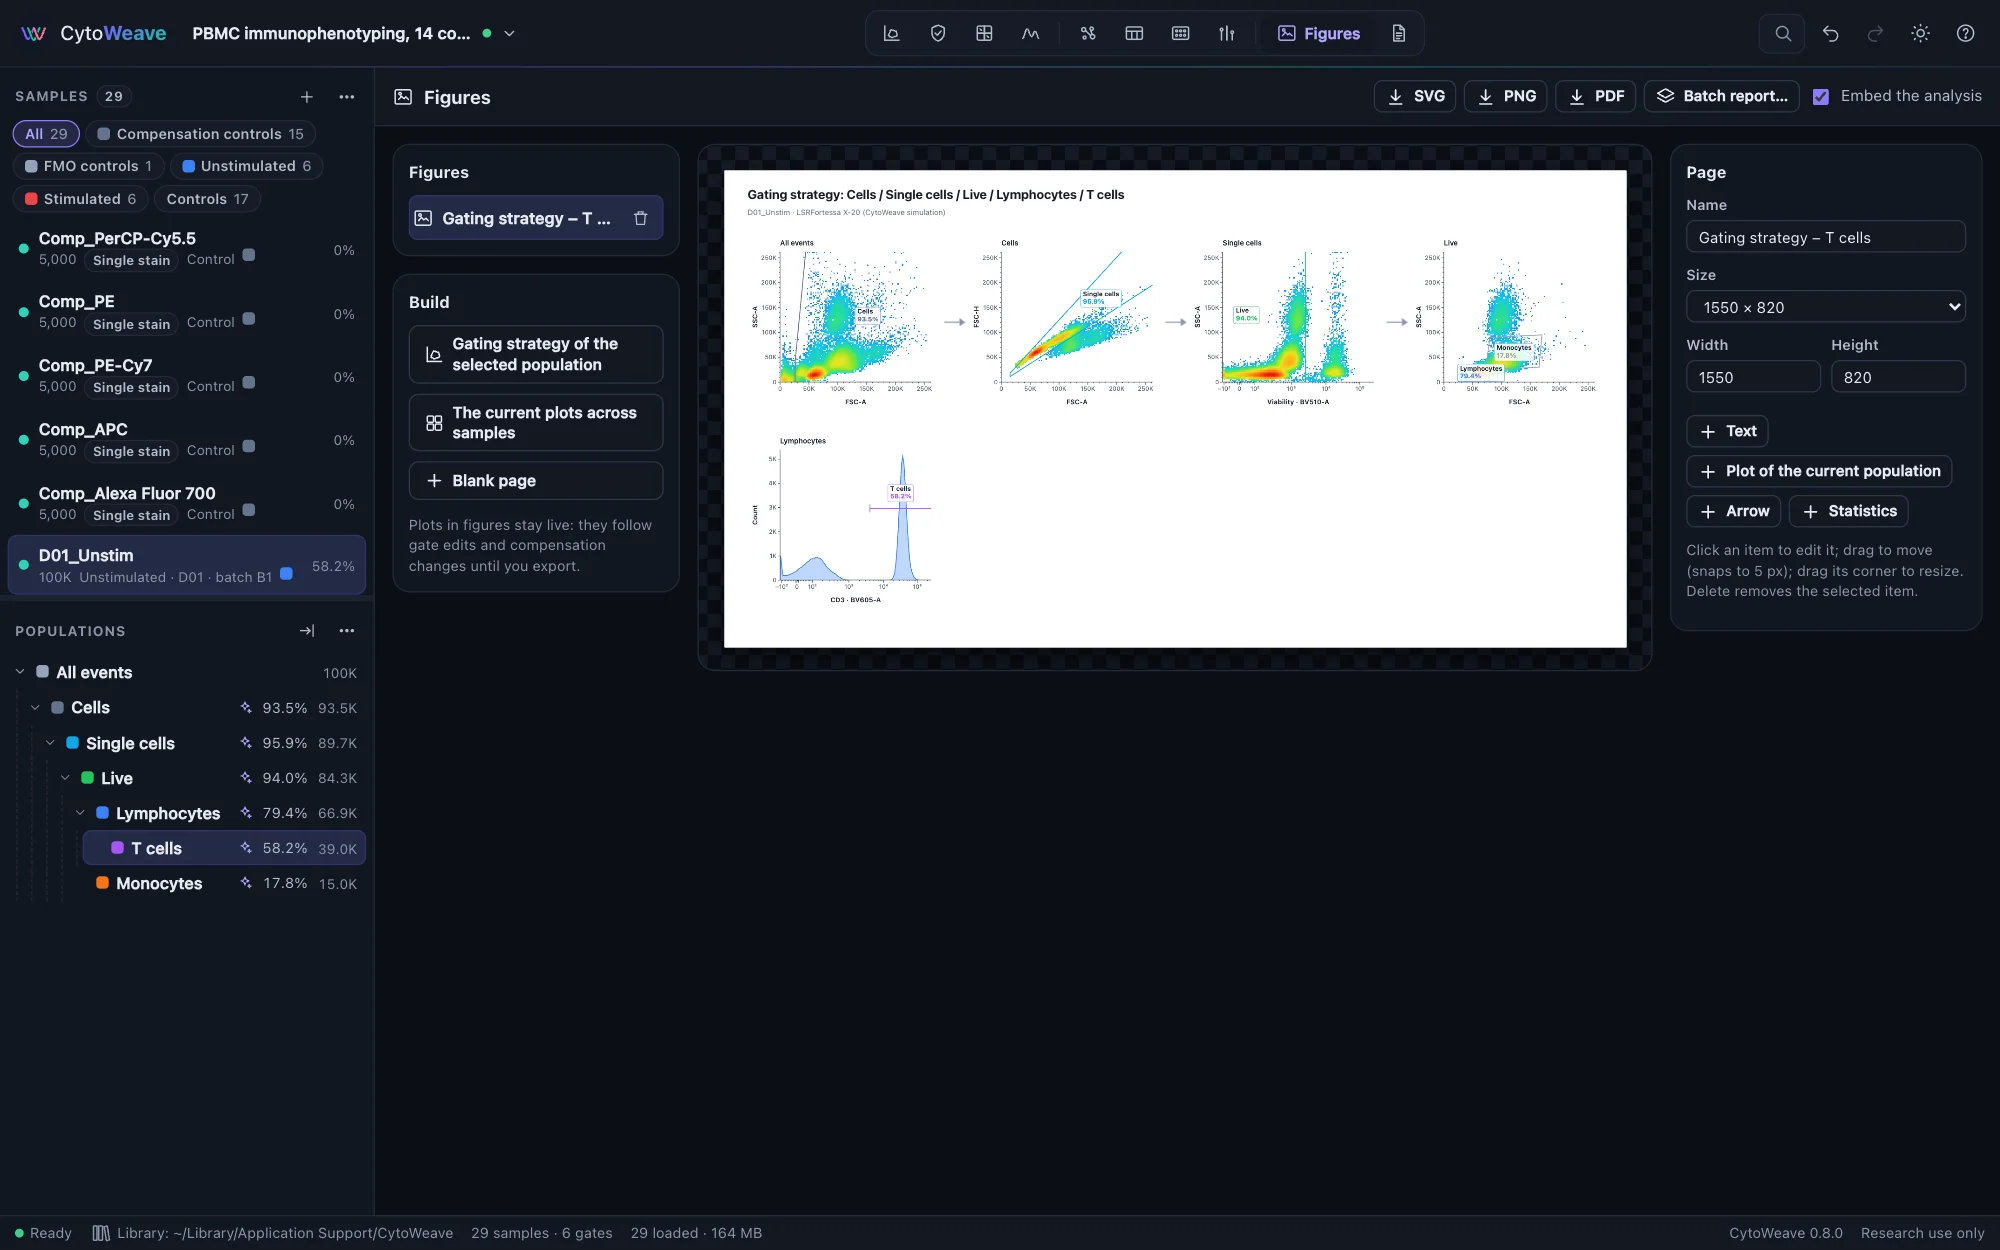
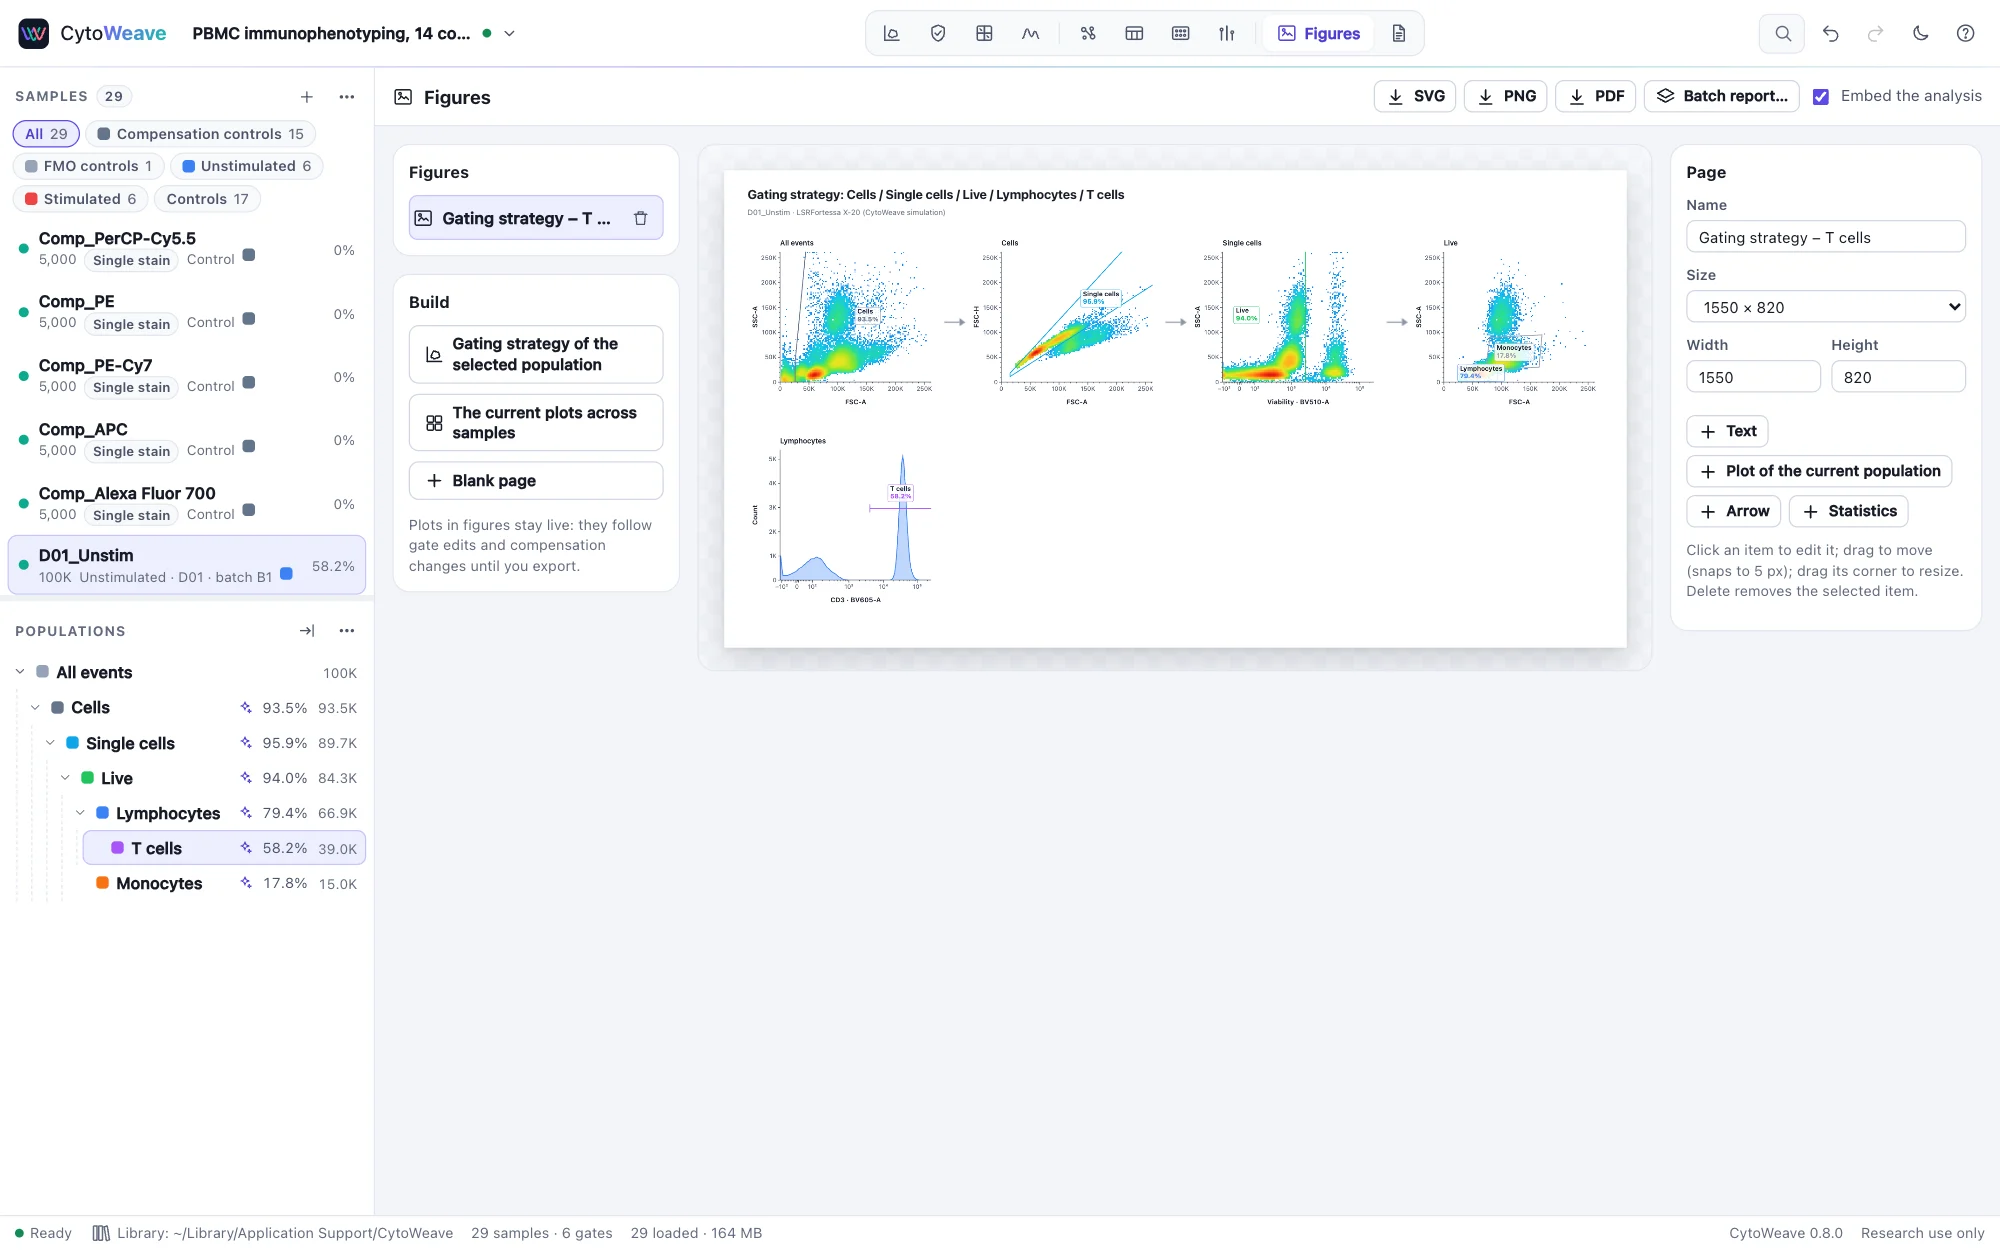
Build the gating strategy of a population in one click, or lay out plots across samples; they stay live until you export SVG, PNG or vector PDF, and a batch report repeats a figure for every sample or subject as a PDF or a PowerPoint deck. Tables go to Excel, with sheets that say where each number comes from, and to Prism. The Report view writes a methods paragraph with numbered references from what the workspace actually did, checkpoints compare two versions of an analysis in plain language, a review report shares it with anyone who has a browser, and a reproducibility certificate lets anyone confirm every number from the files.

  • Exported figures carry the analysis that made them; open one to see what changed
  • Every algorithm with its parameters and seed
  • BibTeX for the references, and a MIFlowCyt checklist
  • "The Live gate moved by 3% of the axis", with its effect on every frequency
  • A review report in one HTML file, every number traced, for readers without CytoWeave
  • A certificate of every number, with a fingerprint to quote, verified bit for bit
Figures, methods and certificates
The Figures view: the gating strategy of T cells laid out on a page with one plot per stepThe Figures view: the gating strategy of T cells laid out on a page with one plot per step
The gating strategy of T cells, laid out in one click and still live.
Batch reports

One figure, every sample, every number traced

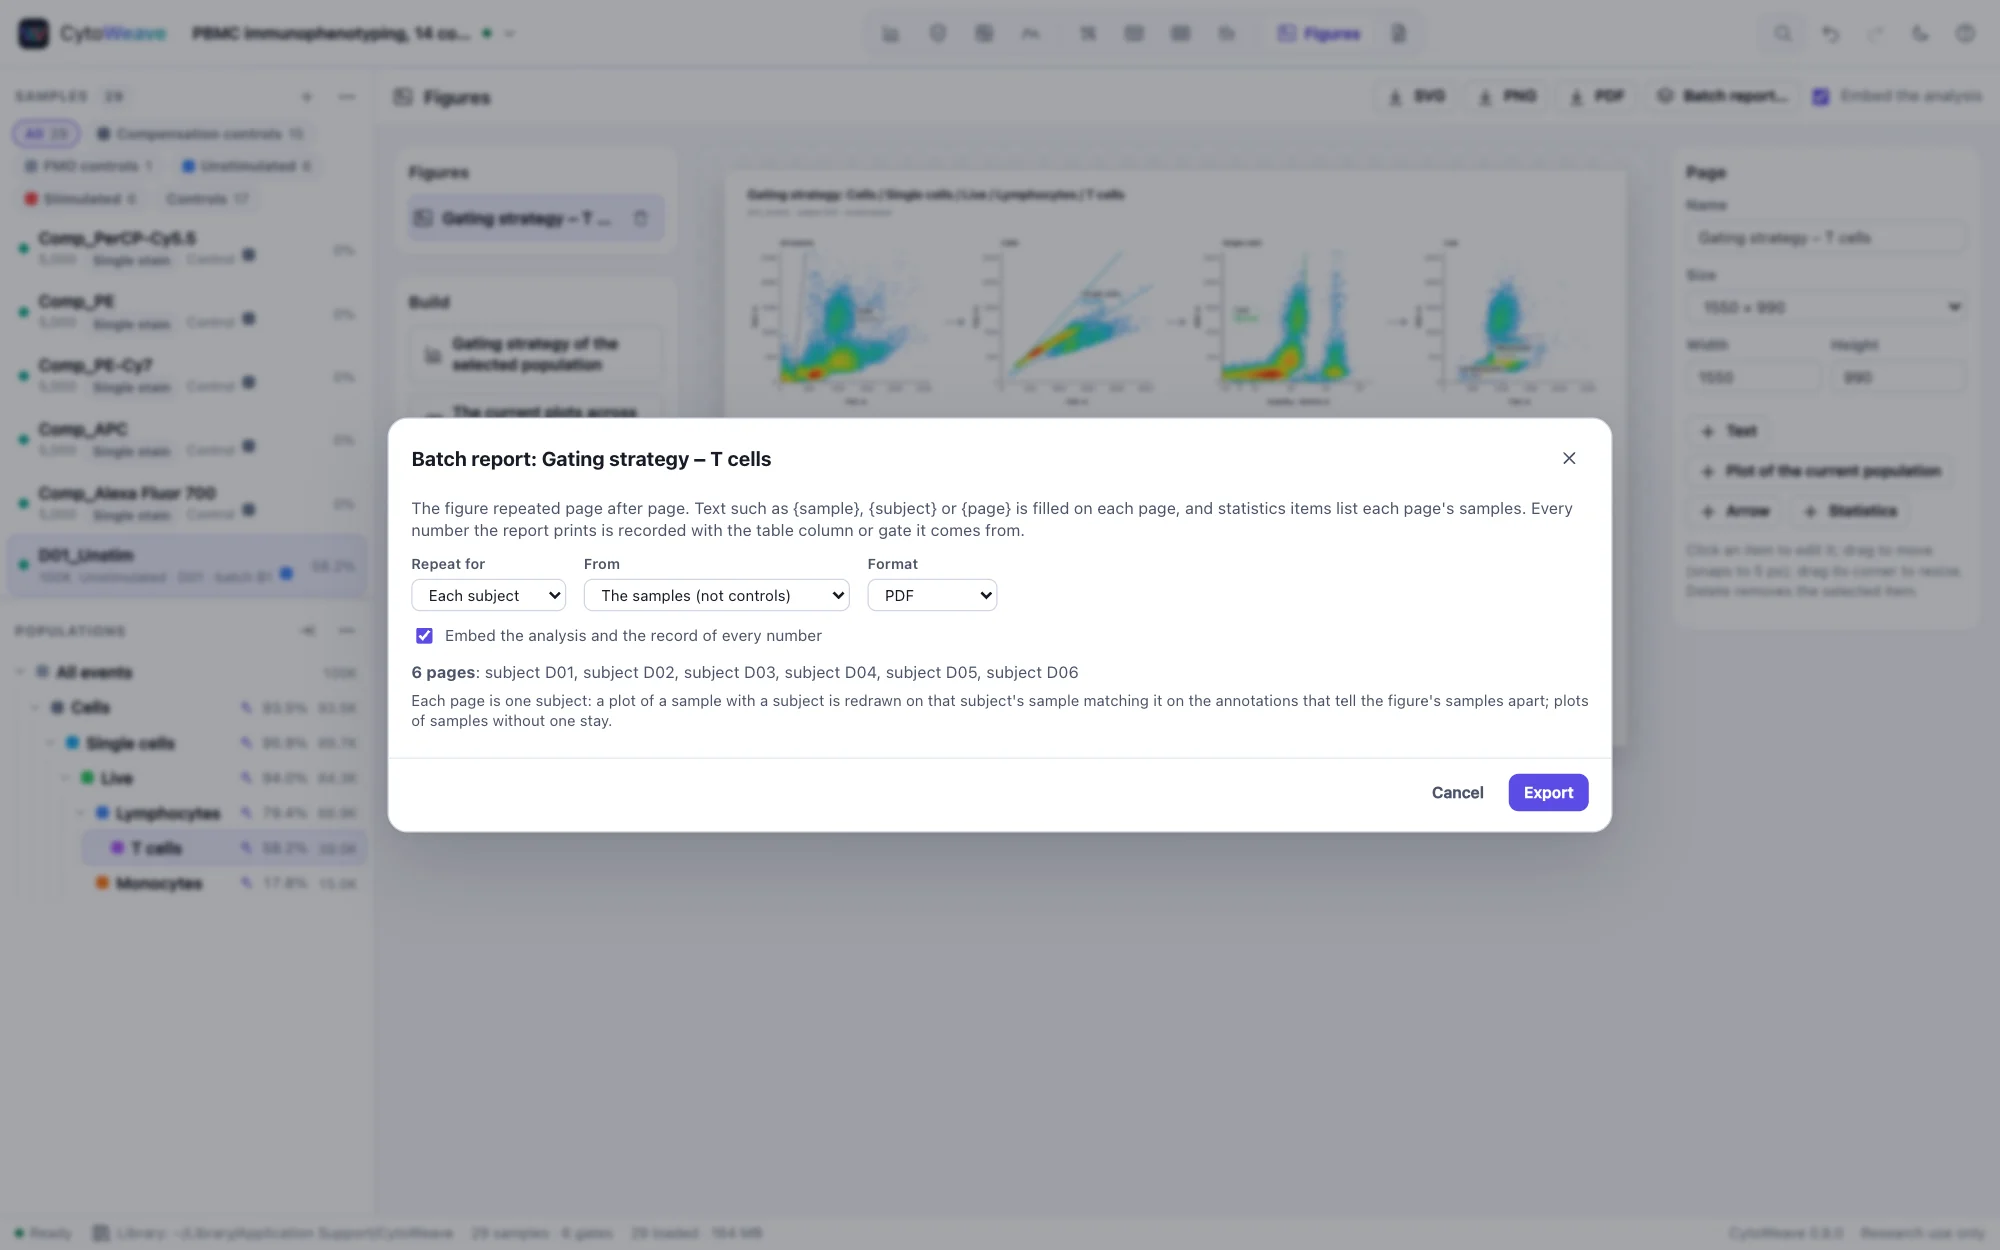
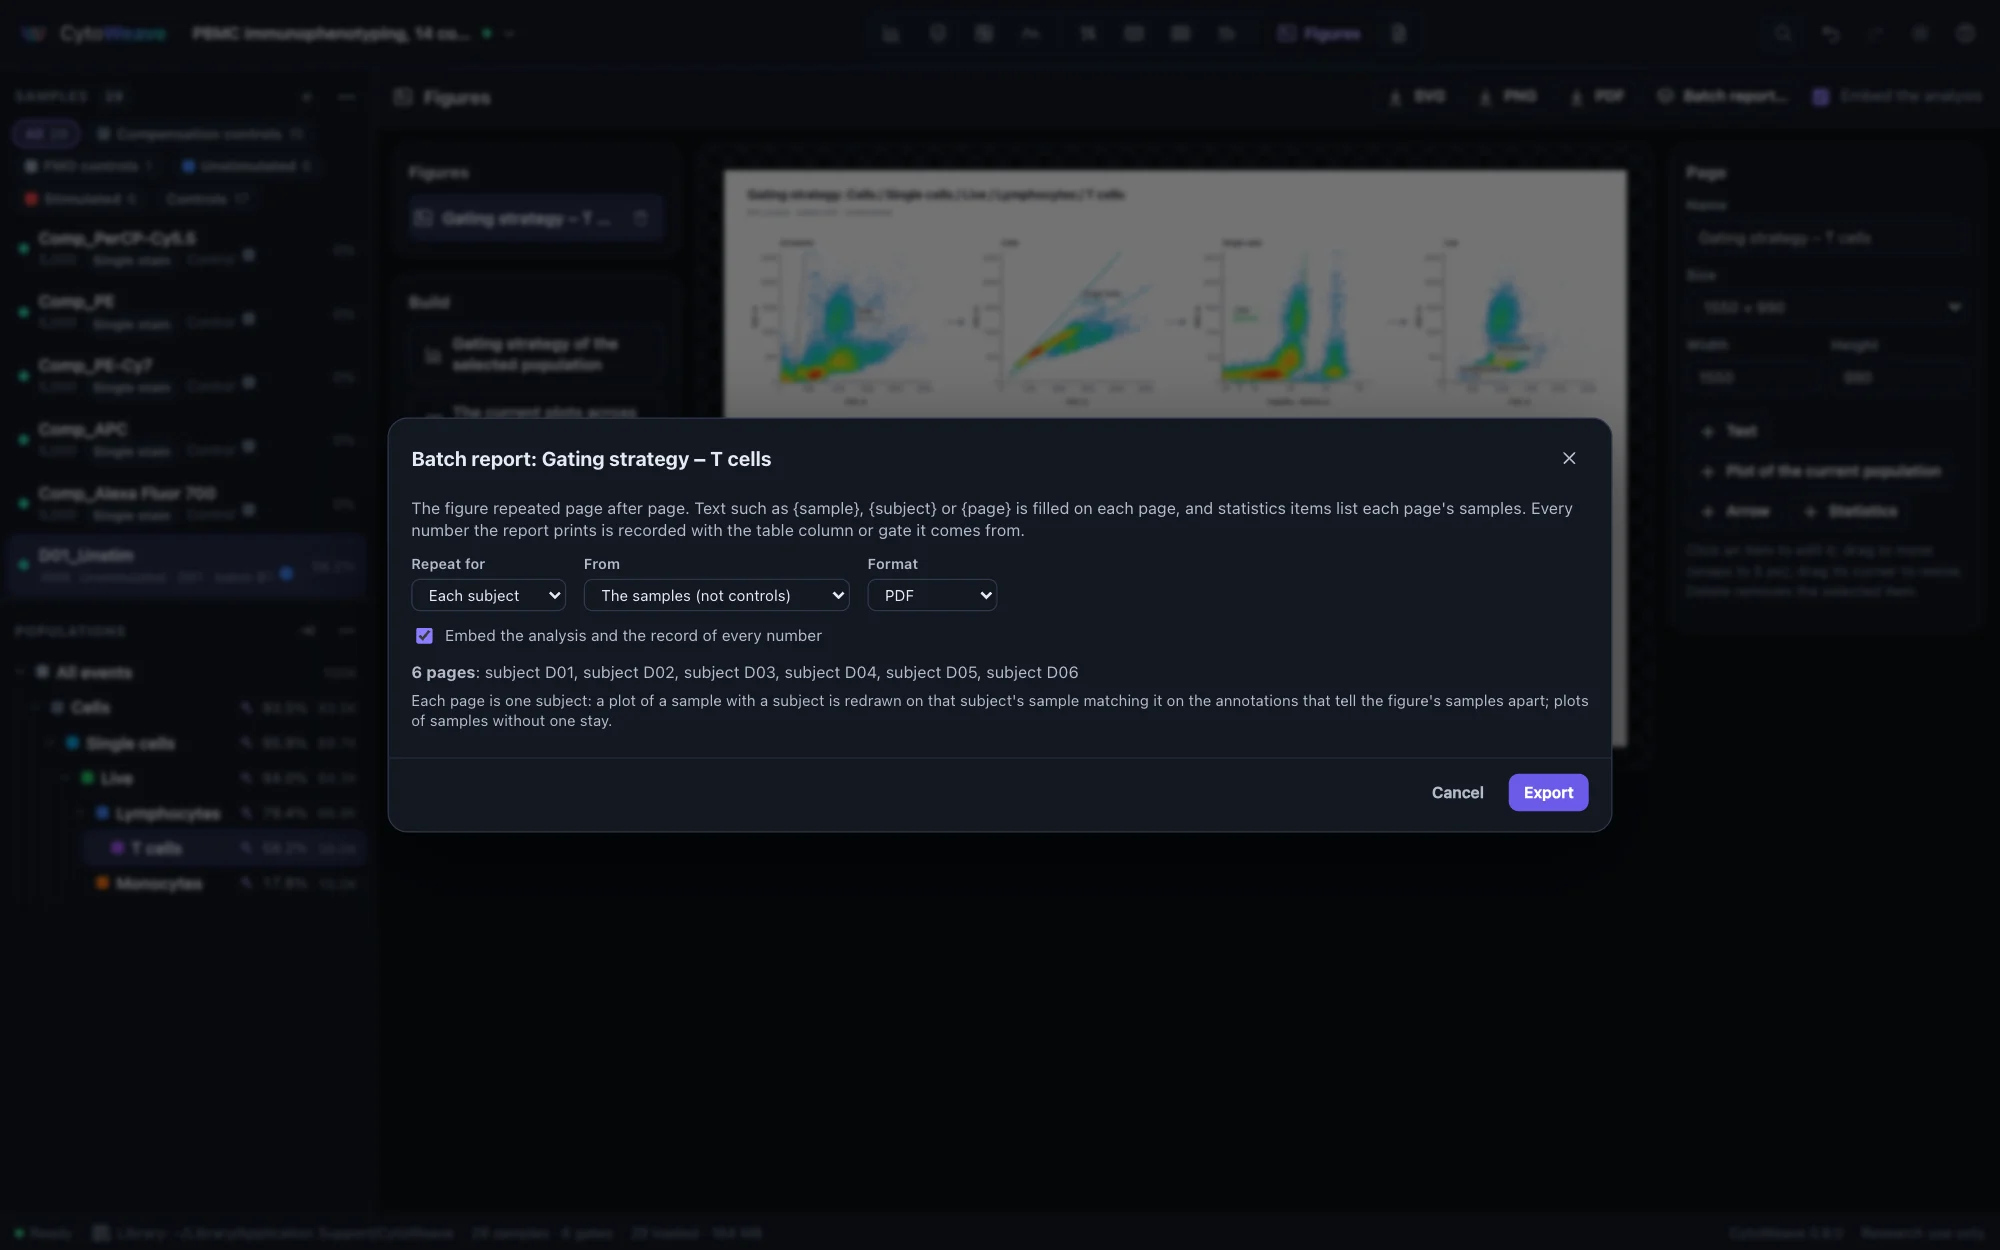
Repeat a figure for each sample or each subject as a multi-page PDF or a PowerPoint deck: each plot redrawn on the page's sample, a control kept on every page, text such as {sample} filled in, and statistics as native tables. Every number printed is recorded with the table column or gate it comes from, and the record travels in the file.

  • Vector PDF with searchable text
  • Excel workbooks that say where each number comes from, and Prism projects
  • Missing tubes and ambiguous replicates reported before anything is written
Batch reports
The batch report dialog: the gating strategy of T cells repeated for each of six subjects as a PDF, with the analysis and the record of every number embeddedThe batch report dialog: the gating strategy of T cells repeated for each of six subjects as a PDF, with the analysis and the record of every number embedded
The gating strategy of T cells, a page for each of six donors.
And more

Built for the work a core and a lab actually do

Index sorting

The plate of sorted cells, each well colored by its cell's population; click a well to find its cell on every plot.

Cell cycle and proliferation

Dean–Jett–Fox and Watson fits of DNA content; generations of dye dilution with division and proliferation indices.

Kinetics

A calcium flux or any signal over time: the Indo-1 ratio's baseline, peak, time to peak, area and responding cells, with tubes overlaid at their stimulus.

Headless runs

cytoweave run applies a template to a folder of files without a window and writes its tables, report, workspace and methods.

Batches and barcodes

CytoNorm normalization with a confounding check, bead normalization for mass cytometry, and debarcoding into one sample per well.

Boolean populations
The events in all of, any of or none of chosen populations, with a live count while you choose.

Ten million events

Files are read in parts and never held whole, populations are bitsets, and background analyses share the events instead of copying them.
Sixteen example experiments, and exercises

Simulated with the truth of every event: a planted compensation error, a FlowJo workspace, a spectral panel and its troubleshooting day 2, a calcium flux, a drug screen, a bead assay, absolute counts, a month of bead QC and more. Exercises on them check your answers against the truth.

Panel design

A panel's spreading matrix predicted from the instrument's own noise: leave a dye out or add one from the library and see the spread before you run it.

QC while you acquire

Watch the instrument's export folder: each file is checked as soon as it is written, so a clog or a failing detector shows before the next tube.

MEF units from beads

A standard curve fitted to multi-level beads, as FlowCal does, and every channel of the samples acquired with them in MEFL or ERF.

Absolute counts

Cells per µL from counting beads or the file's volume, with a dilution that can come from each sample's annotations.

Formula channels

A ratio or any formula of other channels, by marker or detector, to plot, gate and tabulate like any channel, and into Gating-ML as fratio.

Accessible

Color-vision-friendly colors as a setting, WCAG AA contrast in both themes, keyboard operation and plots described for screen readers.

Validated

Same answers as the truth and the reference tools

A validation suite runs the complete pipelines, as the app does, against answers known in advance, published reference values and the tools the methods come from.
AreaChecked againstAgreement
CompensationThe true spillover of the PBMC examplewithin 0.02; planted error found first
BD FACSDivaIts matrix from 15 real single-stain controlsevery entry within 0.015
QCKnown clogs, bubbles and drift99.8–100% of anomalies removed
SpectralTrue abundances of 25 fluorochromesmedian r = 0.988
Gating-MLISAC's compliance suite190 of 190 gates exact
FlowJoFlowJo's saved counts in 14 workspacesas close as FlowKit or closer
FlowJo exportFlowJo 11.2.0 opening three exportsevery population within 0.6 points
FlowJo 11FlowJo 11.2's own counts in twelve workbenchesall 350 reproduced
Dose-responsedrc in R on 8 synthetic curves, a screen and 32 standard curvesnever worse; within 1e-8 from the same start
Bead assaysbeadplexr on its own LEGENDplex databeads identical on 17 of 18 files
AutogatingAn expert's per-donor gates in a real cytokine studyno adjustment moved away from the expert
Q and BflowQB on its own LSR II dataequal within 6e-9
Predicted spreadA BD LSRFortessa's 15 bead controls79% of pairs within 2×
R packagesflowCore, PeacoQC, FlowSOM and CytoNormwithin 1e-7 to 1e-5
Differential statediffcyt and limma in R on the mass cytometry examplesevery test within 3e-11
Probability binningflowStats on tubes with known positive fractionsidentical bins; within 9e-15
MEF unitsFlowCal on its own bead and cell filescells within 1.6%
AnnDataanndata 0.10 and 0.13, h5py and pyfiveevery value read exactly

Methods, validation and citation

Get started in a minute

Install with one command, then run cytoweave. It opens its own window, with sixteen example experiments ready to explore and exercises to practice on.

$ curl --proto '=https' --tlsv1.2 -fsSL https://raw.githubusercontent.com/robert-mcdermott/cytoweave/main/install.sh | sh
$ cytoweave