
AI agents (MCP)
Ask an AI agent to open data, gate, compute statistics and write the methods, in the window you are watching. Its changes are proposals: nothing becomes part of your analysis until you accept it.
What an agent can do
cytoweave mcp is a Model Context Protocol server. Through it, an agent such as Claude Code can:
- open FCS files, folders, workspaces and example experiments, read the samples, channels, markers and gating tree, and annotate the samples;
- propose gates from coordinates, or find them from the data's density (the magic wand, singlets on area against height, or the valley between two modes);
- rename, recolor or delete populations, and propose a compensation matrix computed from the controls;
- run acquisition QC, unmix spectral files, and cluster and map cells across samples;
- analyze an antibody titration or a detector voltage walk;
- lay out a plate, fit dose-response curves, and read a bead immunoassay;
- save and apply analysis templates and the published OMIP-101 and OMIP-090 strategies, and name populations with Cell Ontology terms;
- add formula channels (a ratio of two markers) and calibrate fluorescence in MEF units with beads;
- compute population statistics and tables across samples (absolute counts with counting beads among them), compare samples with a control (% positive, probability binning), and report rare populations with exact intervals and detection limits, and look at plots as images;
- review a gate across the cohort, compare groups of samples, check a comparison against other analysis choices, build figures and write a methods paragraph;
- watch an instrument's export folder, checking each file as it lands;
- export FlowJo workspaces, de-identified FCS files, figures and tables to files, and Gating-ML.
The agent works through the same actions as you do, in the window you see. You can watch every step, take over at any time, and undo anything.
Setting it up
Claude Code
$ claude mcp add cytoweave -- ~/.local/bin/cytoweave mcpUse the full path to the program: agents often start programs without your shell's PATH. On Windows the installer puts it in %LOCALAPPDATA%\Programs\CytoWeave\cytoweave.exe. Then ask, for example:
Open the PBMC example, gate cells, singlets and live cells, then CD3+ T cells
and their CD4 and CD8 subsets, and tell me how the CD4:CD8 ratio differs
between stimulated and unstimulated samples.
Claude Desktop and other clients
Add the server to the client's configuration; for Claude Desktop, claude_desktop_config.json:
{
  "mcpServers": {
    "cytoweave": {
      "command": "/Users/you/.local/bin/cytoweave",
      "args": ["mcp"]
    }
  }
}
Options go after mcp: --port (default 8770; the next free one is used), --data-dir (the workspace library) and --window app|browser|none (how the window opens when a tool needs it). Proposals and the propose_compensation and proposals tools need CytoWeave 0.2.0 or later, adapt_gate 0.3.0, check_robustness 0.4.0, and the QC, unmixing, clustering, annotation, figure, folder-watching, export, template, cell-type and titration tools 0.5.0, and compare_distributions, rare_events, add_formula_channel, calibrate_beads, export_report, export_events and differential_analysis 0.6.0 (as do Excel and Prism files from export_table and CSV files of events in open_files), and diagnose_unmixing, kinetics, plate, plate_layout, dose_response, bead_assay and export_workspace 0.7.0, and export_certificate, verify_certificate, export_review_report and virtual_fmo 0.8.0.
Reviewing proposals
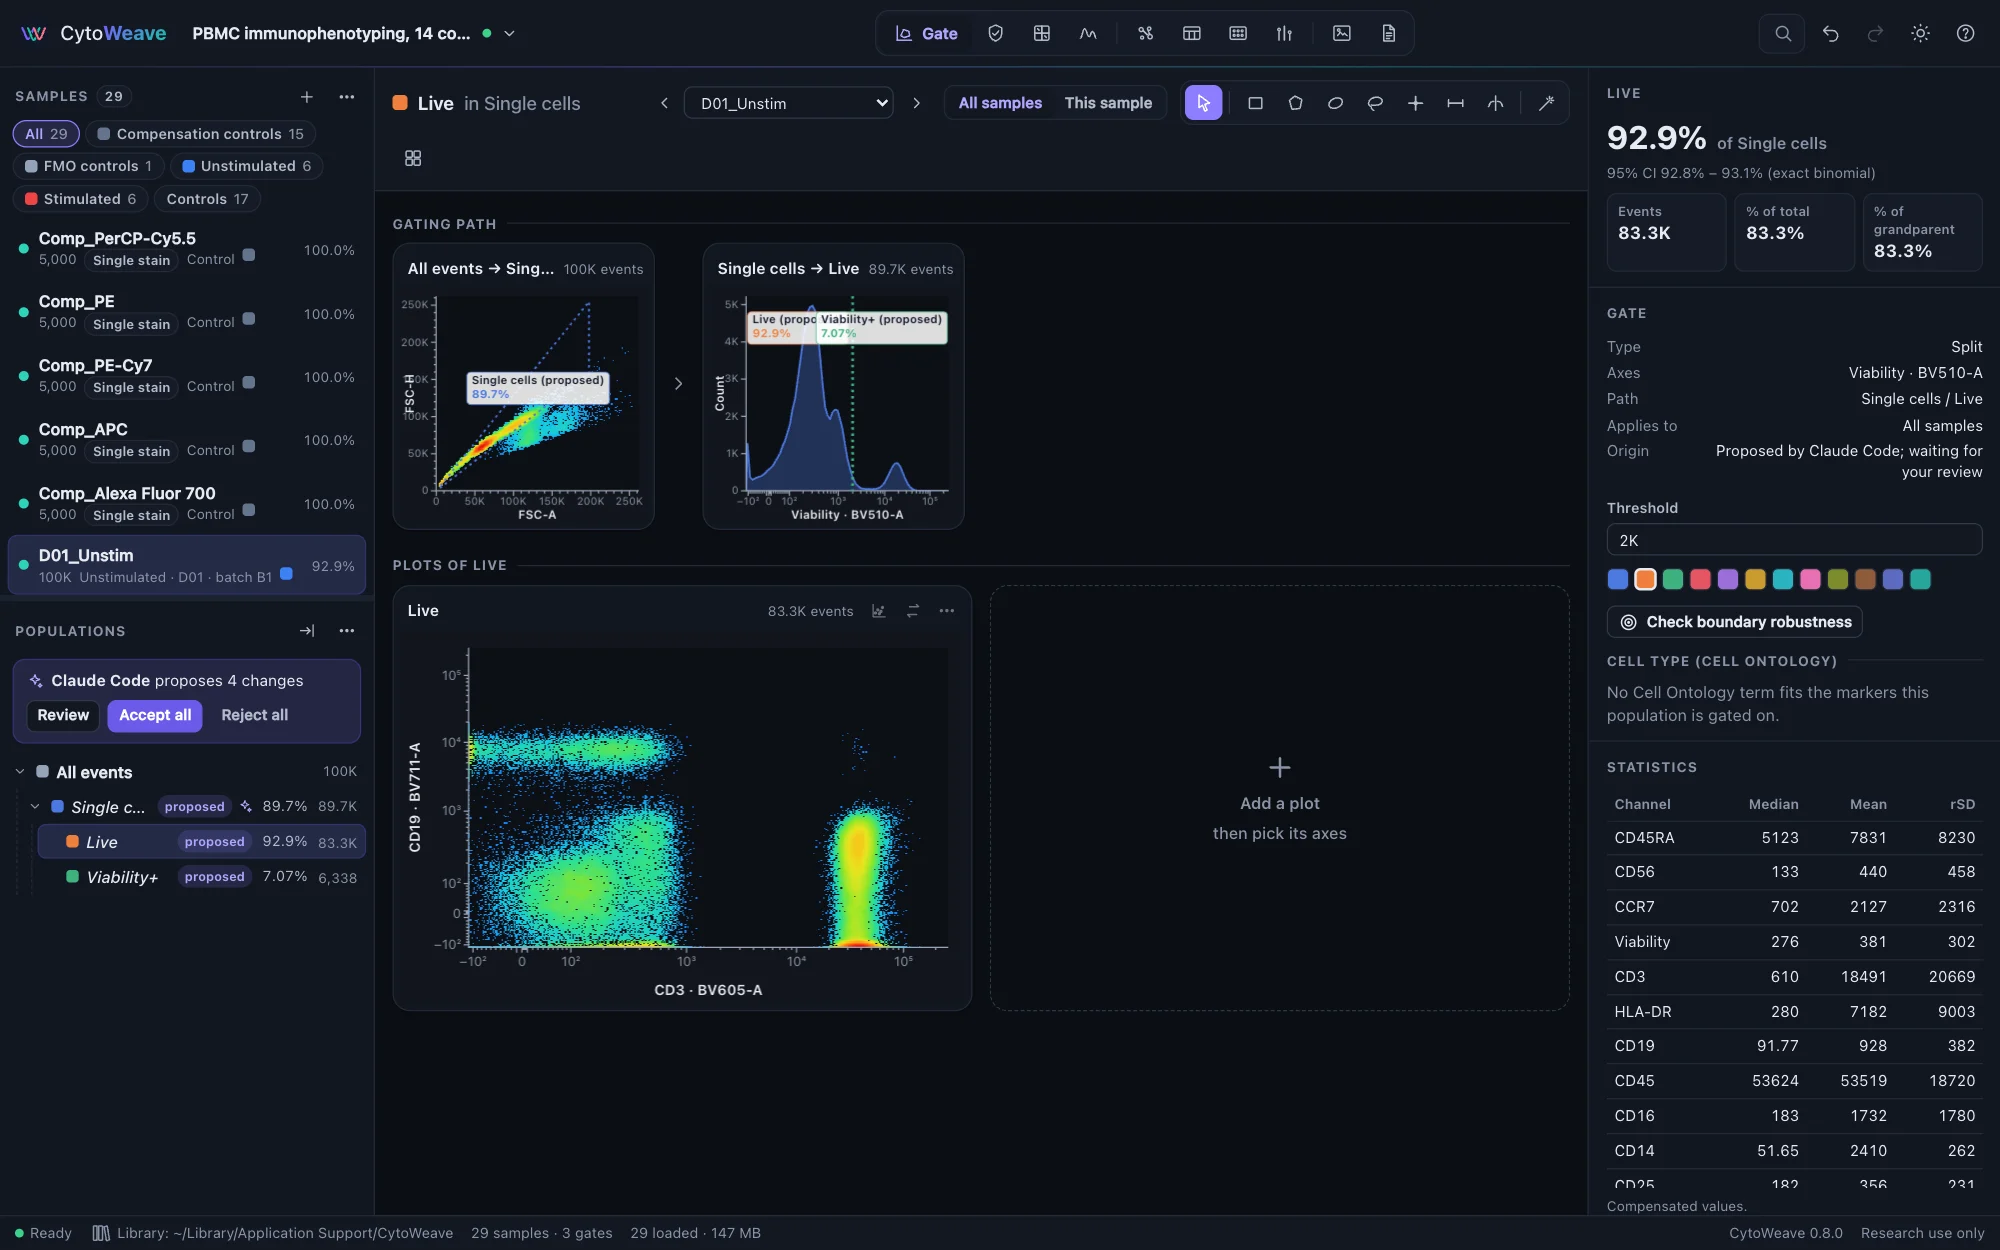
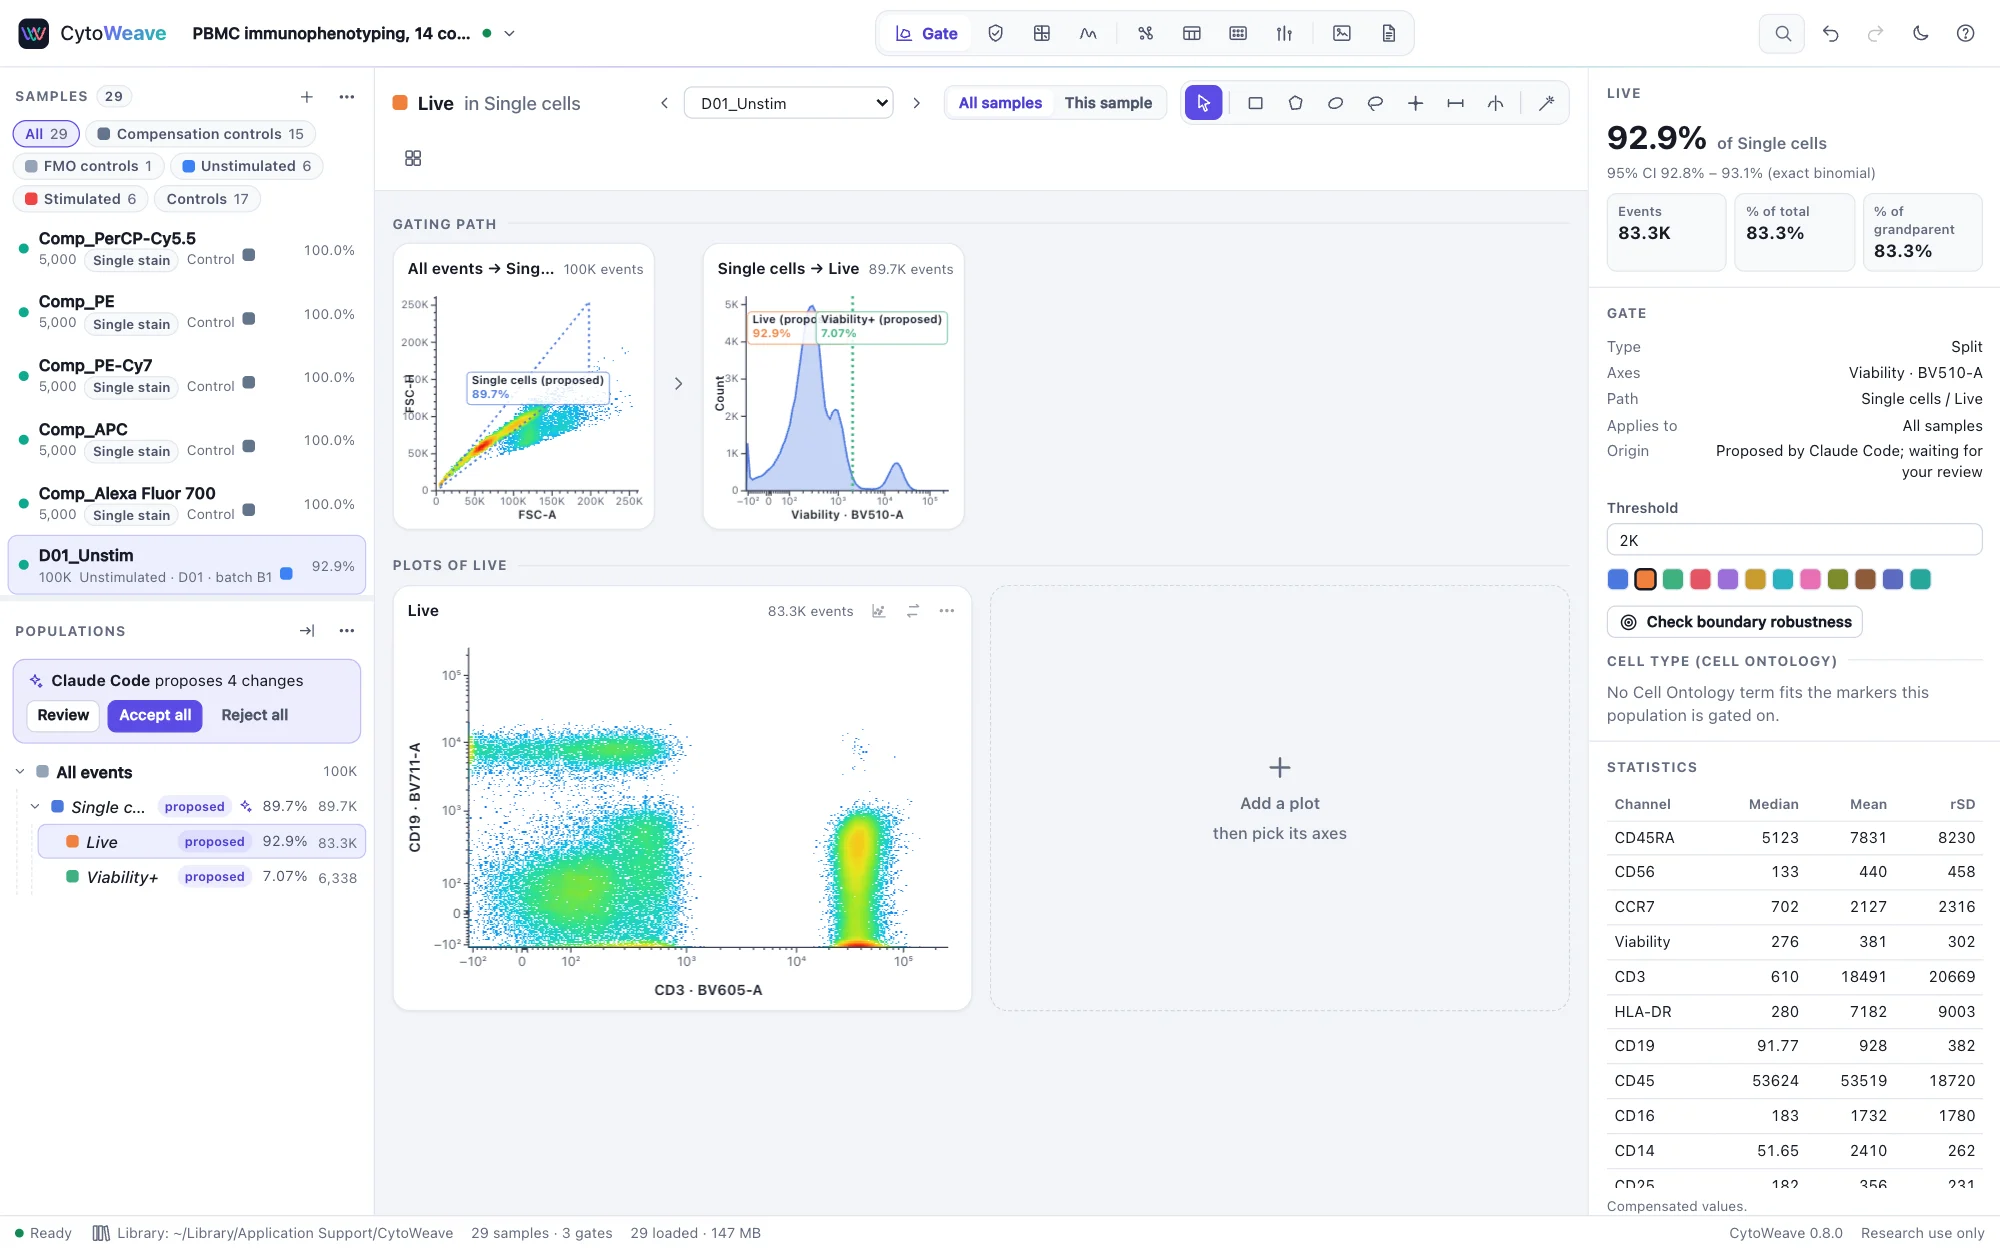
- New gates appear at once, marked proposed: dotted on the plots and in italics in the population tree. Their counts are real, so you can judge them, and the agent can gate on them.
- Computed results (acquisition QC, unmixed channels, clusters and maps) and figures also appear at once, marked proposed, so their channels can be gated and plotted. Results for samples you have already checked or unmixed stay yours; QC of other samples joins your result when you accept.
- Renaming or deleting gates you have accepted, compensation matrices, sample annotations and a "QC pass" gate at the top of the tree are held. The tree shows a held rename next to the name (→ new name) and strikes through a population the agent proposes to delete.
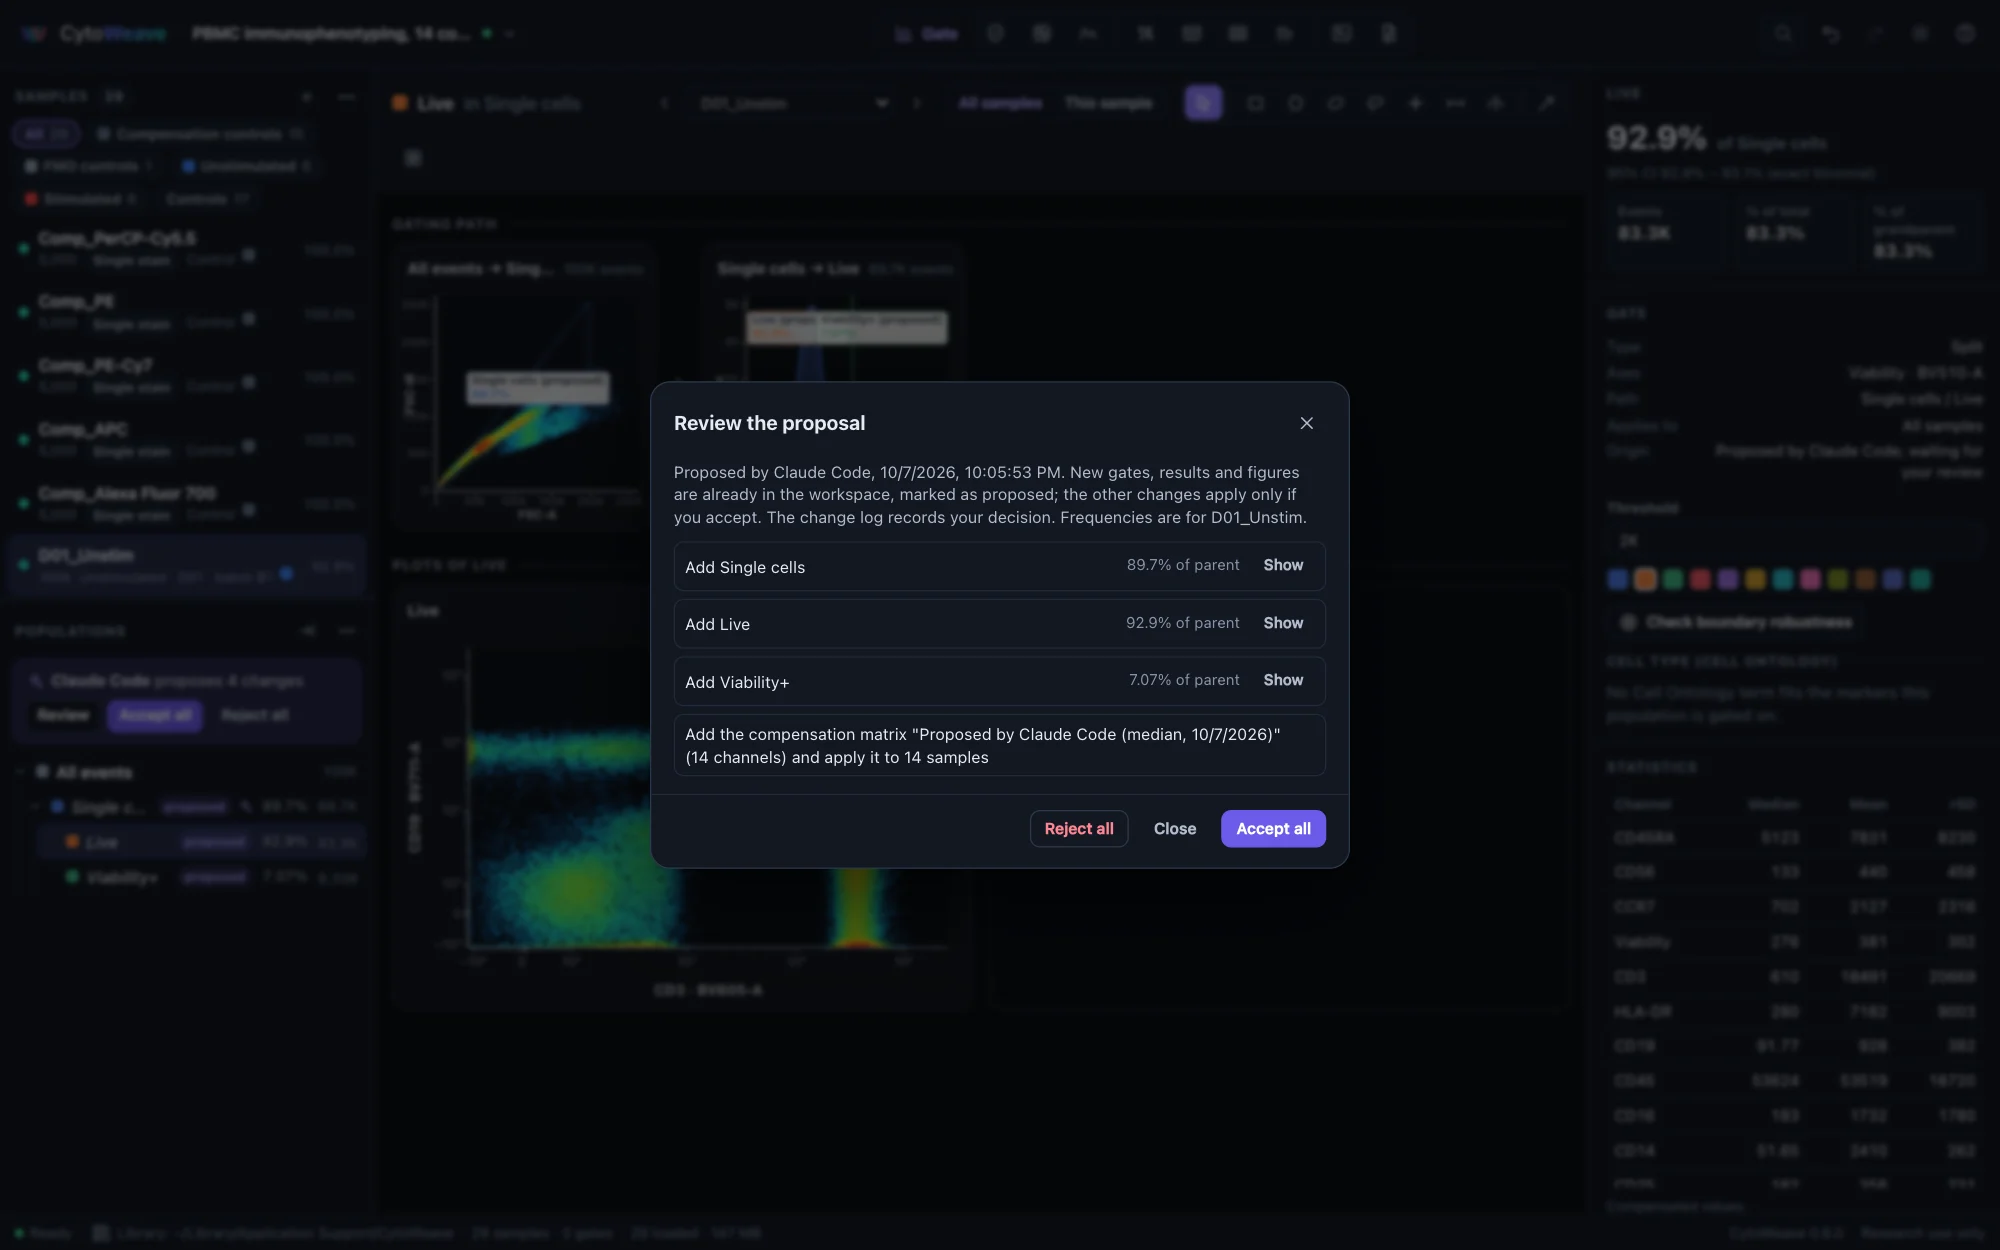
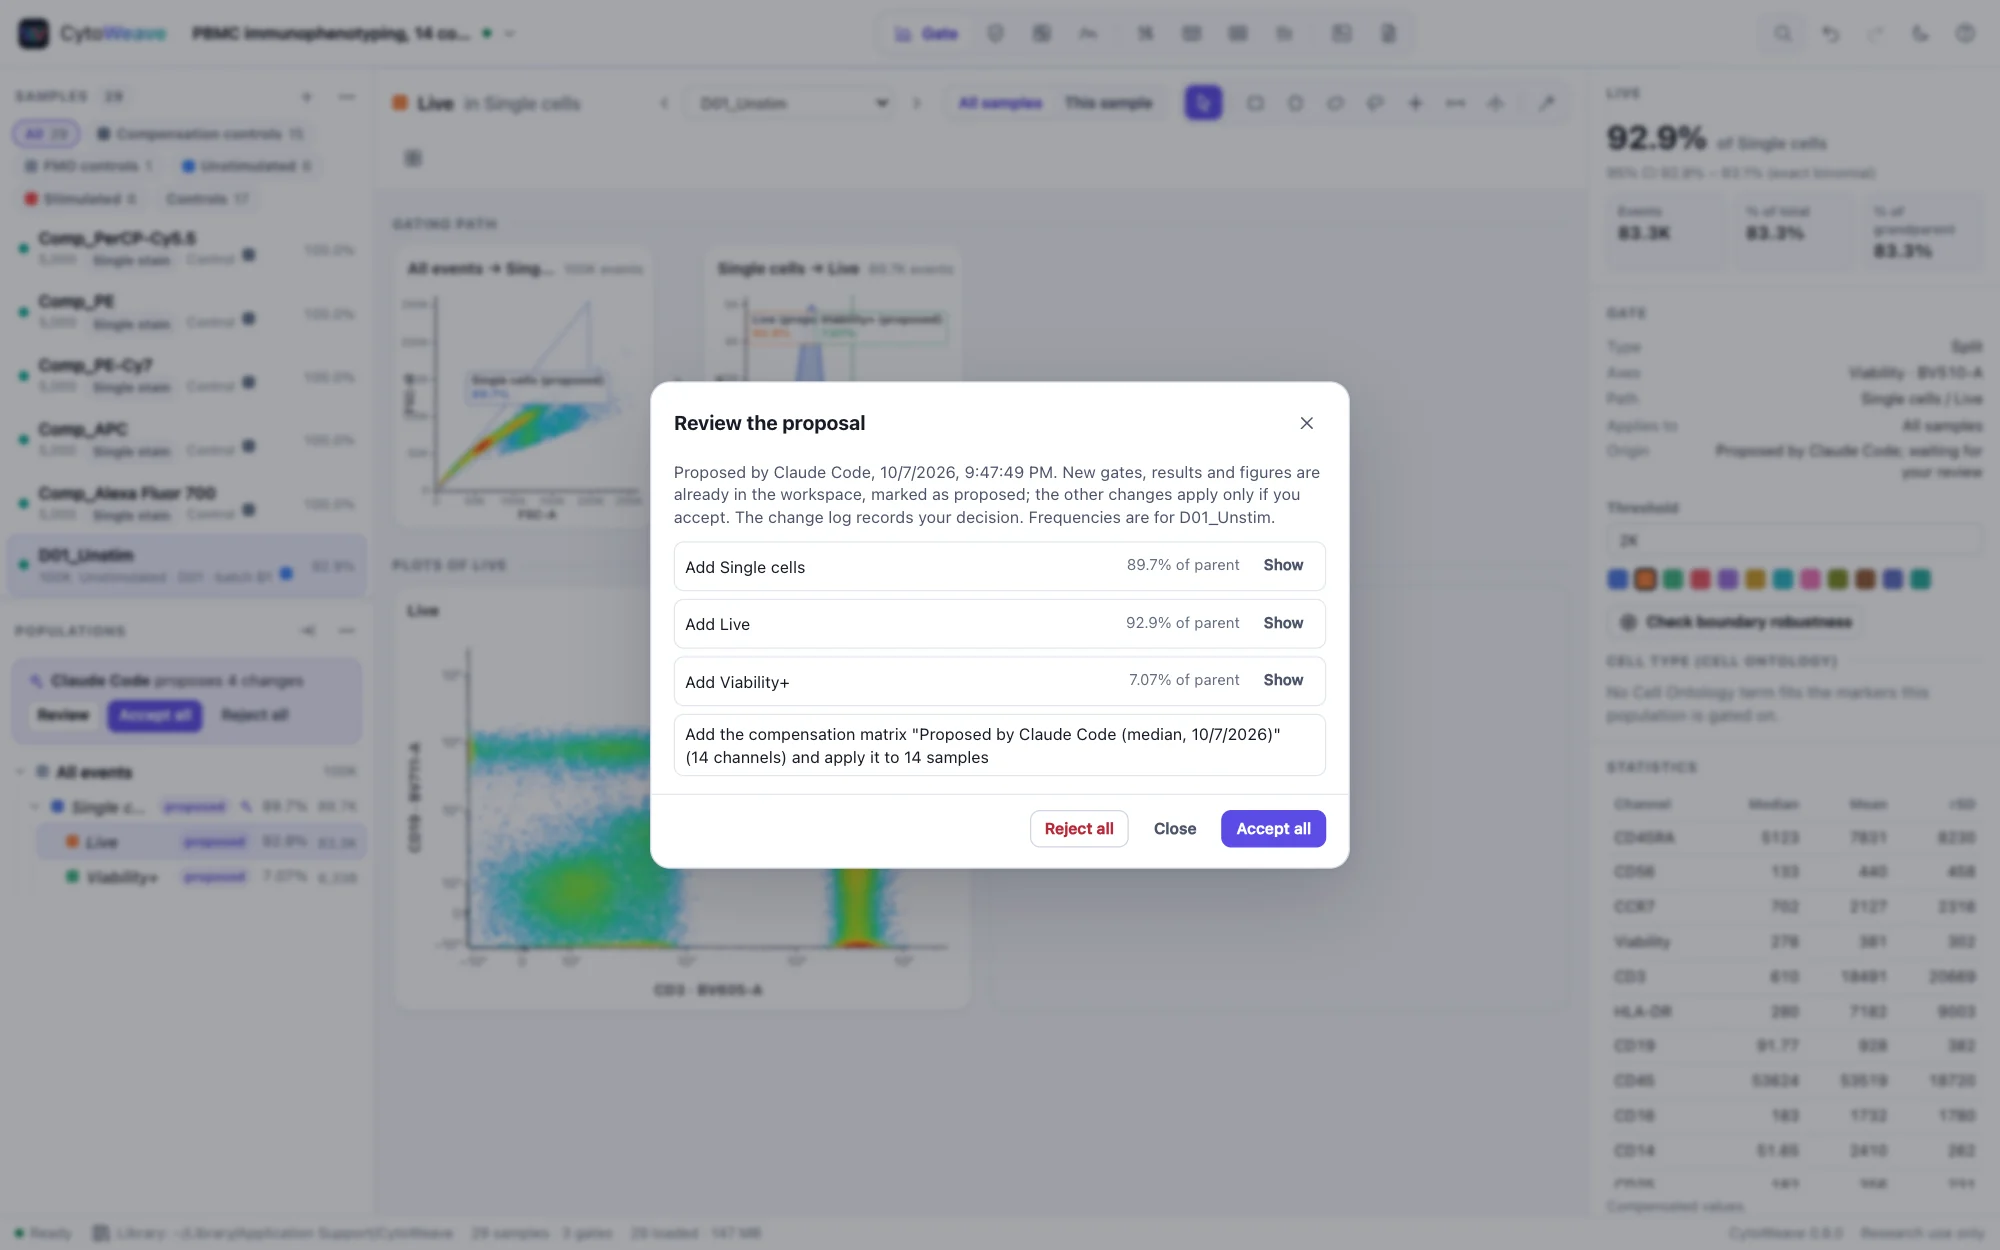
A strip above the population tree says who proposes how many changes. Click Review for the list, with each new population's frequency and a Show button, then Accept all or Reject all. Rejecting removes the proposed gates, results and figures together with anything drawn under or on them since; CytoWeave asks first in that case.
The change log records each decision: what was proposed, by which agent (the name its MCP client gives, such as Claude Code), and whether you accepted or rejected it. Accepted gates keep that origin, and the inspector and the methods paragraph show it. The agent can ask for the outcome with the proposals tool.
Tools
| Tool | What it does |
|---|---|
workspace_summary | Samples (events, role, metadata, channels and markers), groups, the gating tree of the current sample with counts, compensation, derived results, and what the window shows |
open_files | Opens FCS files, folders, CytoWeave or FlowJo workspaces, Gating-ML, or CSV files of events (each a sample, its columns checked), by absolute path |
open_example | Generates and opens a simulated example experiment |
select | Shows a sample, population or view in the window |
list_populations | Every population's path, gate, count, % of parent and % of total for a sample |
population_statistics | Count, frequencies and per-channel statistics of a population |
statistics_table | A statistic of populations across samples or a group |
render_plot | A PNG of a plot with its gates |
create_gate | Proposes a rectangle, polygon, ellipse, range, quadrant or split gate from data coordinates |
auto_gate | Proposes a gate found from the data: a density basin around a point, singlets, or the valley between two modes |
edit_gate | Renames, recolors or deletes a population (held for review unless the agent proposed it) |
check_compensation | Check a compensation matrix against the single-stain controls, as Check against the controls does: the entries that are off, each with its suggested value |
propose_compensation | Computes a spillover matrix from the single-stain controls and proposes it for the samples |
proposals | The agent's open proposal and your recent decisions |
review_gate | A gate's frequency on every sample with a robust z-score and boundary robustness, outliers first |
adapt_gate | Adapts a gate to every sample with a confidence for each: confident adjustments are proposed, uncertain samples listed for you to check; groupBy keeps one gate per donor or subject |
compare | Tests a statistic between groups of samples defined by annotations, optionally paired |
differential_analysis | Tests every cluster (or chosen populations) between groups of samples: differential state, each marker's median by diffcyt-DS-limma, or differential abundance, each cluster's share of the parent; with pairing and covariates in the model |
check_robustness | Repeats a two-group comparison under other reasonable analysis choices (gate boundaries, adapted gates, QC, compensation, test) and reports whether the conclusion holds, mostly holds or is fragile, and which choices change it |
annotate_samples | Sets samples' metadata fields, roles and stained channels (held for review) |
run_qc | Acquisition QC: each sample's score, events removed and findings; the "QC pass" channel is proposed, and with addGate a "QC pass" gate at the top of the tree |
unmix | Spectral unmixing with reference spectra from the controls and autofluorescence from the unstained control; a reference library is computed and proposed when there is none |
explore | Clustering (FlowSOM, Leiden, Louvain, k-means) and a map (UMAP, t-SNE, PCA) across samples, with cluster names, abundances and the map's faithfulness; populations proposes the clusters as populations |
build_figure | Proposes a figure: the gating strategy of a population, or the same plots across samples |
watch_folder | Watches an instrument's export folder and checks each file as it lands |
save_template, list_templates | Save the analysis (or a population and those under it) as a template in the library; list the templates and the published strategies |
apply_template | Applies a template or a strategy (omip-101, omip-090) with channels matched by marker, saying how each matched and what was left out; a strategy's gates are placed on one sample's events. The gates and figures are proposed |
suggest_cell_types | A Cell Ontology term for each population from its phenotype, never its name, with a confidence and the markers it rests on; propose proposes the top terms for you to confirm |
titration | Analyzes an antibody titration (amounts from the file names) or a detector voltage walk (voltages from $PnV): each step's stain and separation index, and the recommended amount or voltage range; save proposes the result |
diagnose_unmixing | Names the likely causes of a poor spectral unmixing, most likely first, each with its evidence and a fix tried on the sample's events |
kinetics | A signal or ratio (Indo-1 violet/blue) against acquisition time: baseline, peak, time to peak, half-max time, area and the share of responding events, per sample |
plate, plate_layout | The plates and their layout fields, a statistic in every well as a grid with Z′ from the control wells; a layout from CSV or plate maps, held for review |
dose_response | EC50 or IC50 curves per compound (four or five parameters, as drc parameterizes them) with 95% CIs, Hill slope, asymptotes and flags; raw, % of controls or % inhibition |
bead_assay | A bead immunoassay (LEGENDplex, CBA): analytes by classification level, standard curves, and each sample's concentrations with the quantifiable range and limit of detection |
add_formula_channel | Proposes a channel computed from others ([CD4] / [CD8], log([CD25])), usable at once in gates, plots and statistics |
calibrate_beads | Calibrates channels in MEF units from a multi-level bead sample, as FlowCal does, and proposes the calibrated channels for the samples acquired with the beads' settings |
compare_distributions | Each sample's population against a control sample's on a channel: % positive by SED and Overton, probability binning's T(χ), the K-S D; several channels for multivariate probability binning |
rare_events | Exact intervals of a rare population's count and frequency, the events needed for a target CV, and limits of blank, detection and quantification from blank and low-level samples |
export_flowjo, export_fcs, export_figure, export_report, export_events, export_table, export_workspace | Write a FlowJo workspace, the workspace (.cwz), de-identified FCS files, a population's events in several samples (concatenated into one FCS file with SampleID and SourceEvent channels, one FCS file per sample, or AnnData .h5ad; optionally downsampled with a seed), a figure (SVG, PNG, PDF), a batch report (a figure repeated for each sample or each value of an annotation, as PDF or PowerPoint, with the pages and any notes) or statistics (CSV, TSV, an Excel workbook with its provenance sheets, a Prism project grouped by an annotation) to an absolute path; never replace a file unless told to |
virtual_fmo | Predict where a population's negative for a dye ends without it (a virtual FMO), beside the FMO and unstained controls, with the dyes the spread comes from; optionally propose a gate above it |
design_panel | Design a panel: the dye for each marker from its expression and the markers on the same cells, with each marker's predicted stain index, what limits it, the next best dyes and pairs prone to energy transfer; from the experiment's reference or compensation controls, or an instrument's spectral library |
export_review_report | Write a review report: the analysis as one self-contained HTML file, every sample's gates drawn and every number traced |
export_certificate, verify_certificate | Write a reproducibility certificate of the analysis (with its FCS files, or only their checksums), and verify one: every number computed again from the files and compared, with the verdict and what differs |
methods | A methods paragraph with numbered references |
export_gating_ml | The gating strategy as Gating-ML 2.0 |
Populations are named by name (when unique), by path (Cells/Single cells/CD3+) or by id; channels by detector (FITC-A) or marker (CD3). Gate coordinates are data values, as on the plot axes, on each channel's scale: a range gate on CD3 above 1,000 is {"min": 1000}.
How well agents do
The agent benchmark gives agents analysis tasks on simulated experiments whose answers are known (gate a population, find a compensation error, test a difference, name an acquisition problem, find a degraded tandem, read a dose-response plate, write a report) and grades their results against the truth. Its page shows each model's score, by task. An agent's work is still a proposal: review it as you would a colleague's.
Privacy and how it works
cytoweave mcp starts CytoWeave with remote control on and speaks JSON-RPC on standard input and output. A tool call becomes an action that the server forwards to the open window, which performs it with the same code as the user interface and posts the result back, one action at a time. Everything stays on your computer: the server accepts requests only from this computer, and opening and writing files by path is limited to the agent connected over MCP or to scripts holding the token CytoWeave prints at startup. What the agent's model sees of your data is what the tools return: counts, statistics, gating trees and plot images.
The full reference, including coordinates for every gate type, is docs/MCP.md in the repository.