
Calibration
Calibration asks how far an assay's functional scores separate variants whose effect is already known. It starts from a control set, the variants with their labels as their source gives them, and measures the separation when asked. Nothing here runs by itself, and MaveScape does not classify variants.
For research
Three questions stay apart in MaveScape: whether an assay measures what a question needs, which functional class a variant falls in in this assay, and how a variant is classified clinically. The Calibrate view addresses only how far the scores separate variants already labeled elsewhere. Its labels are always shown with their source ("ClinVar: Likely pathogenic ★★"); MaveScape's own words for a variant stay a functional score, a functional class in this assay and an evidence strength marked for research use.
Control sets
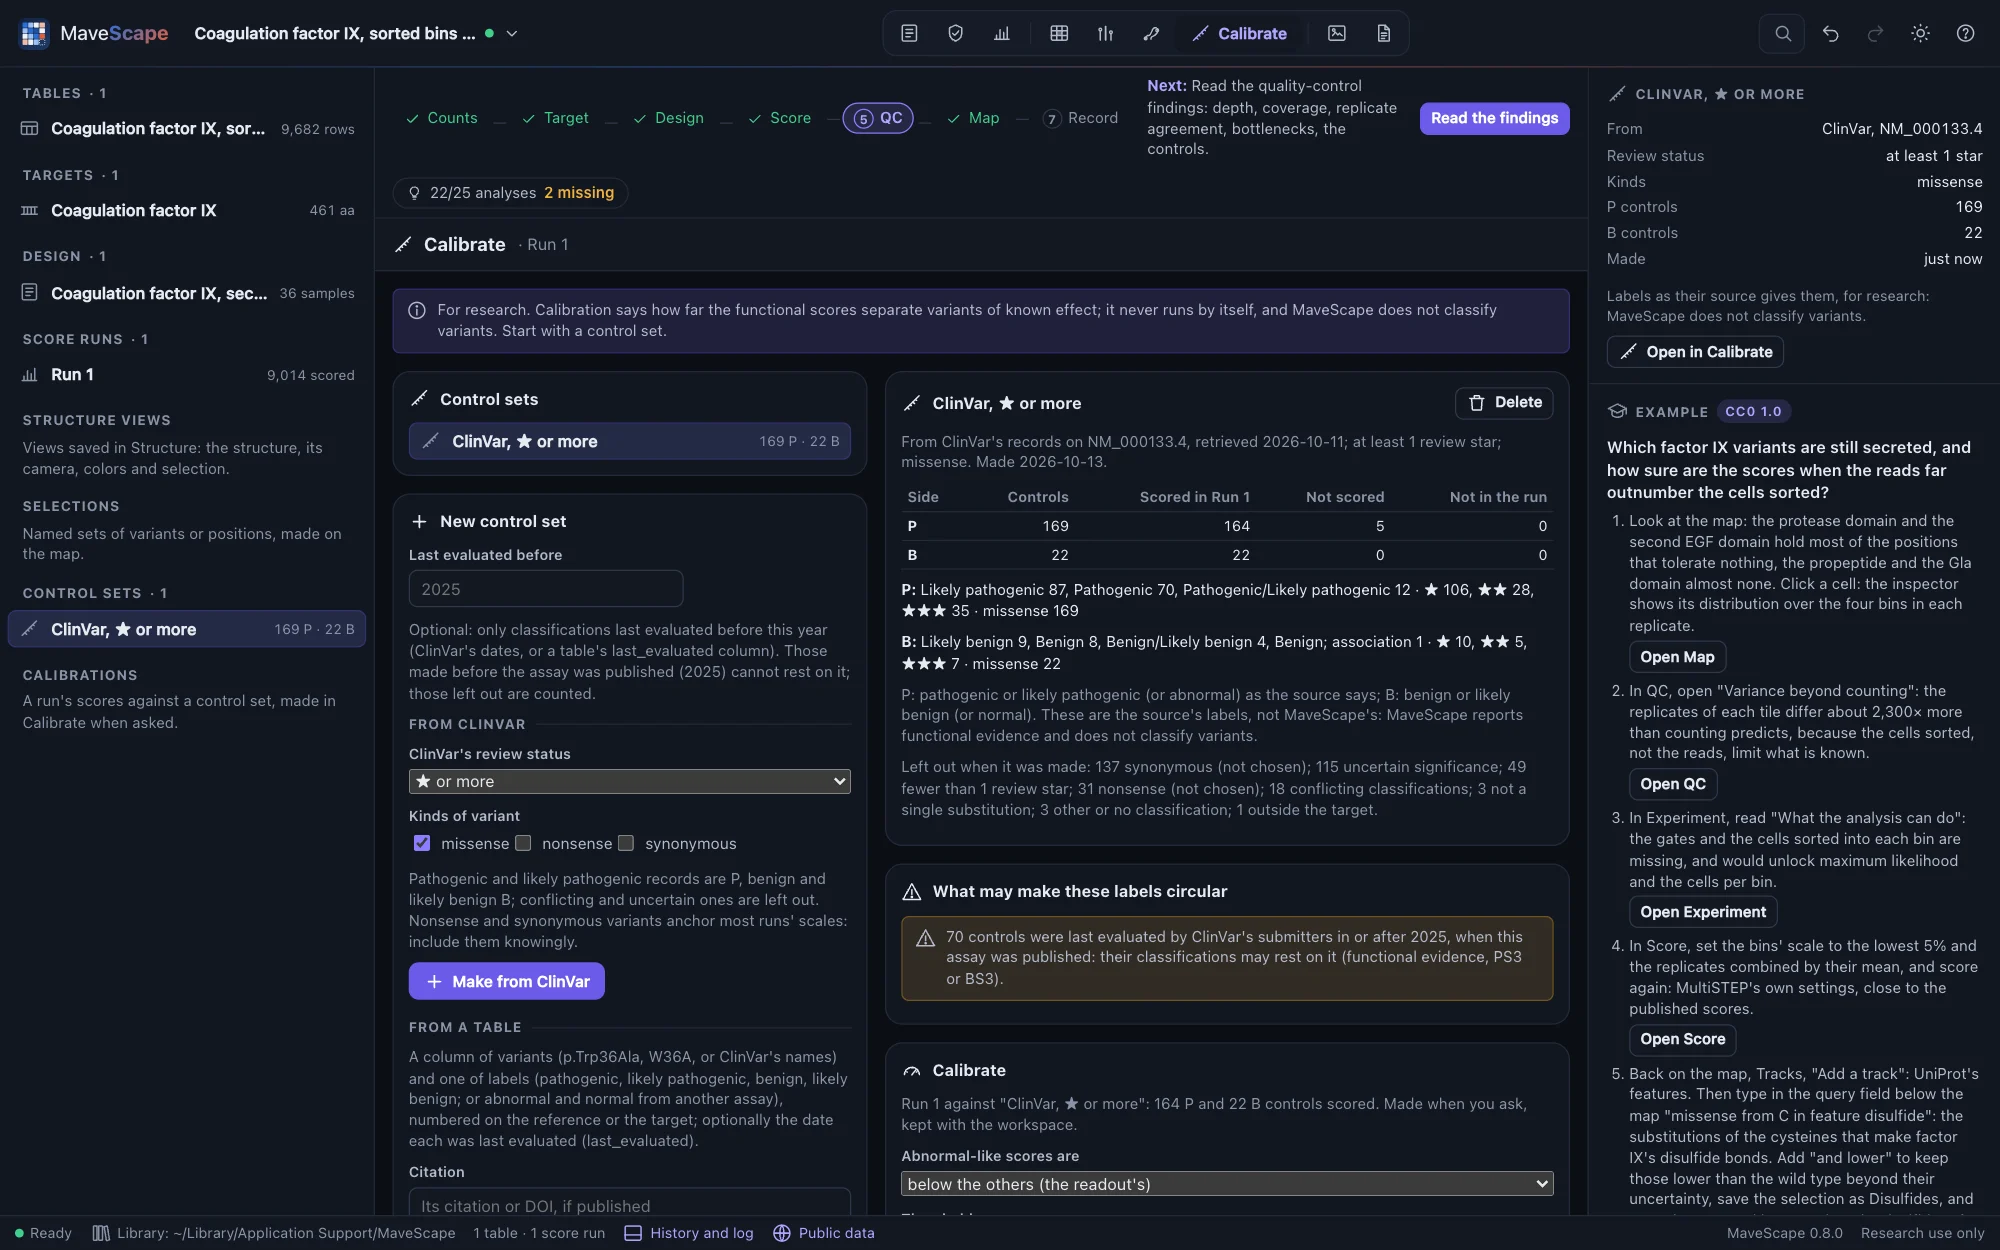

A control set holds variants whose effect is known, each label as its source gives it. Its two sides are P (pathogenic or likely pathogenic, or abnormal in another assay) and B (benign or likely benign, or normal). In Calibrate, New control set makes one:
- From ClinVar: from the ClinVar track's records of the gene (add it first in Map, Tracks; it needs the target's gene symbol, which a UniProt check gives). Pathogenic and likely pathogenic records are P, benign and likely benign B; conflicting and uncertain records are left out. By default a record needs at least one review star (criteria provided) and only missense variants are kept: nonsense and synonymous variants set most runs' scales, so including them is a choice to make knowingly. Records are placed on the target as the ClinVar track places them: the transcript most of them name, numbered by the target's offset, where the residues agree.
- From a table: a CSV or TSV with a column of variants (
p.Trp36Ala,W36A, or ClinVar's names) and one of labels (pathogenic, likely pathogenic, benign, likely benign, or abnormal and normal from another assay), numbered on the reference or the target, whichever its residues agree with; optionally a column of the date each label was last evaluated (last_evaluated; ClinVar's tabular download, "Germline date last evaluated", is read as it is). Give its citation if it was published. FORMATS.md lists the column names it reads.
Last evaluated before (optional, for either source) keeps only the classifications last evaluated before a year: those made before an assay was published cannot rest on it. Give the assay's year (the field suggests it when the workspace knows it); the set counts what it left out, including labels with no date, and says its rule wherever it is named.
Records of the same protein change on one side become one label, with all their accessions; a change labeled on both sides is left out. The set says what it left out and why: uncertain, conflicting, too few stars, a kind not chosen, another transcript, outside the target, a residue the target lacks, a label it could not read.
Matched to a run
The view matches the set to the run shown (the one focused, or the latest) at the protein level, a nucleotide run through its protein view: each control is scored, not scored (in the run, but filtered or missing) or not in the run. The table below lists every label with its source, its state and its score in the run.
What may make labels circular
Labels are evidence about the scores only when they were not made from them. For the run shown, the view says when:
- nonsense or synonymous controls score where the run's scale puts them: its rescaling (nonsense median 0, wild type 1), its bins' scale or its normalization to the synonymous variants uses them;
- controls are among the design's own named controls;
- ClinVar's classifications, or a table's dated ones, were last evaluated in or after the year the assay was published, so they may rest on it (functional evidence, ACMG/AMP's PS3 or BS3); when the year is not recorded, it says so. A set made of those last evaluated before that year has none;
- nonsense or synonymous controls on published scores: how the authors set their scale is not recorded, and where they normalized or rescaled by such variants, as most do, those score where the scale puts them;
- a table's labels come from the assay's own publication (the same DOI);
- fewer than 10 controls on a side are scored, too few for any measure of separation to rely on;
- a predictor beside the map had its classes set with ClinVar's classifications (AlphaMissense's were).
Kept with the workspace
A set is made once and keeps its labels as they were then, with where they came from: the ClinVar annotation's file by its SHA-256 and its retrieval date, or the table's file by its SHA-256 and its citation. Sets are in the dataset tree, go into the workspace's archive, and making and deleting one are in its history; a checkpoint's diff names them. An AI agent's set is made at once and marked proposed, and deleting yours waits for you (Reviewing an agent's changes). Scripts and agents use make_control_set, control_sets and remove_control_set (Agents and scripts).
Calibrations
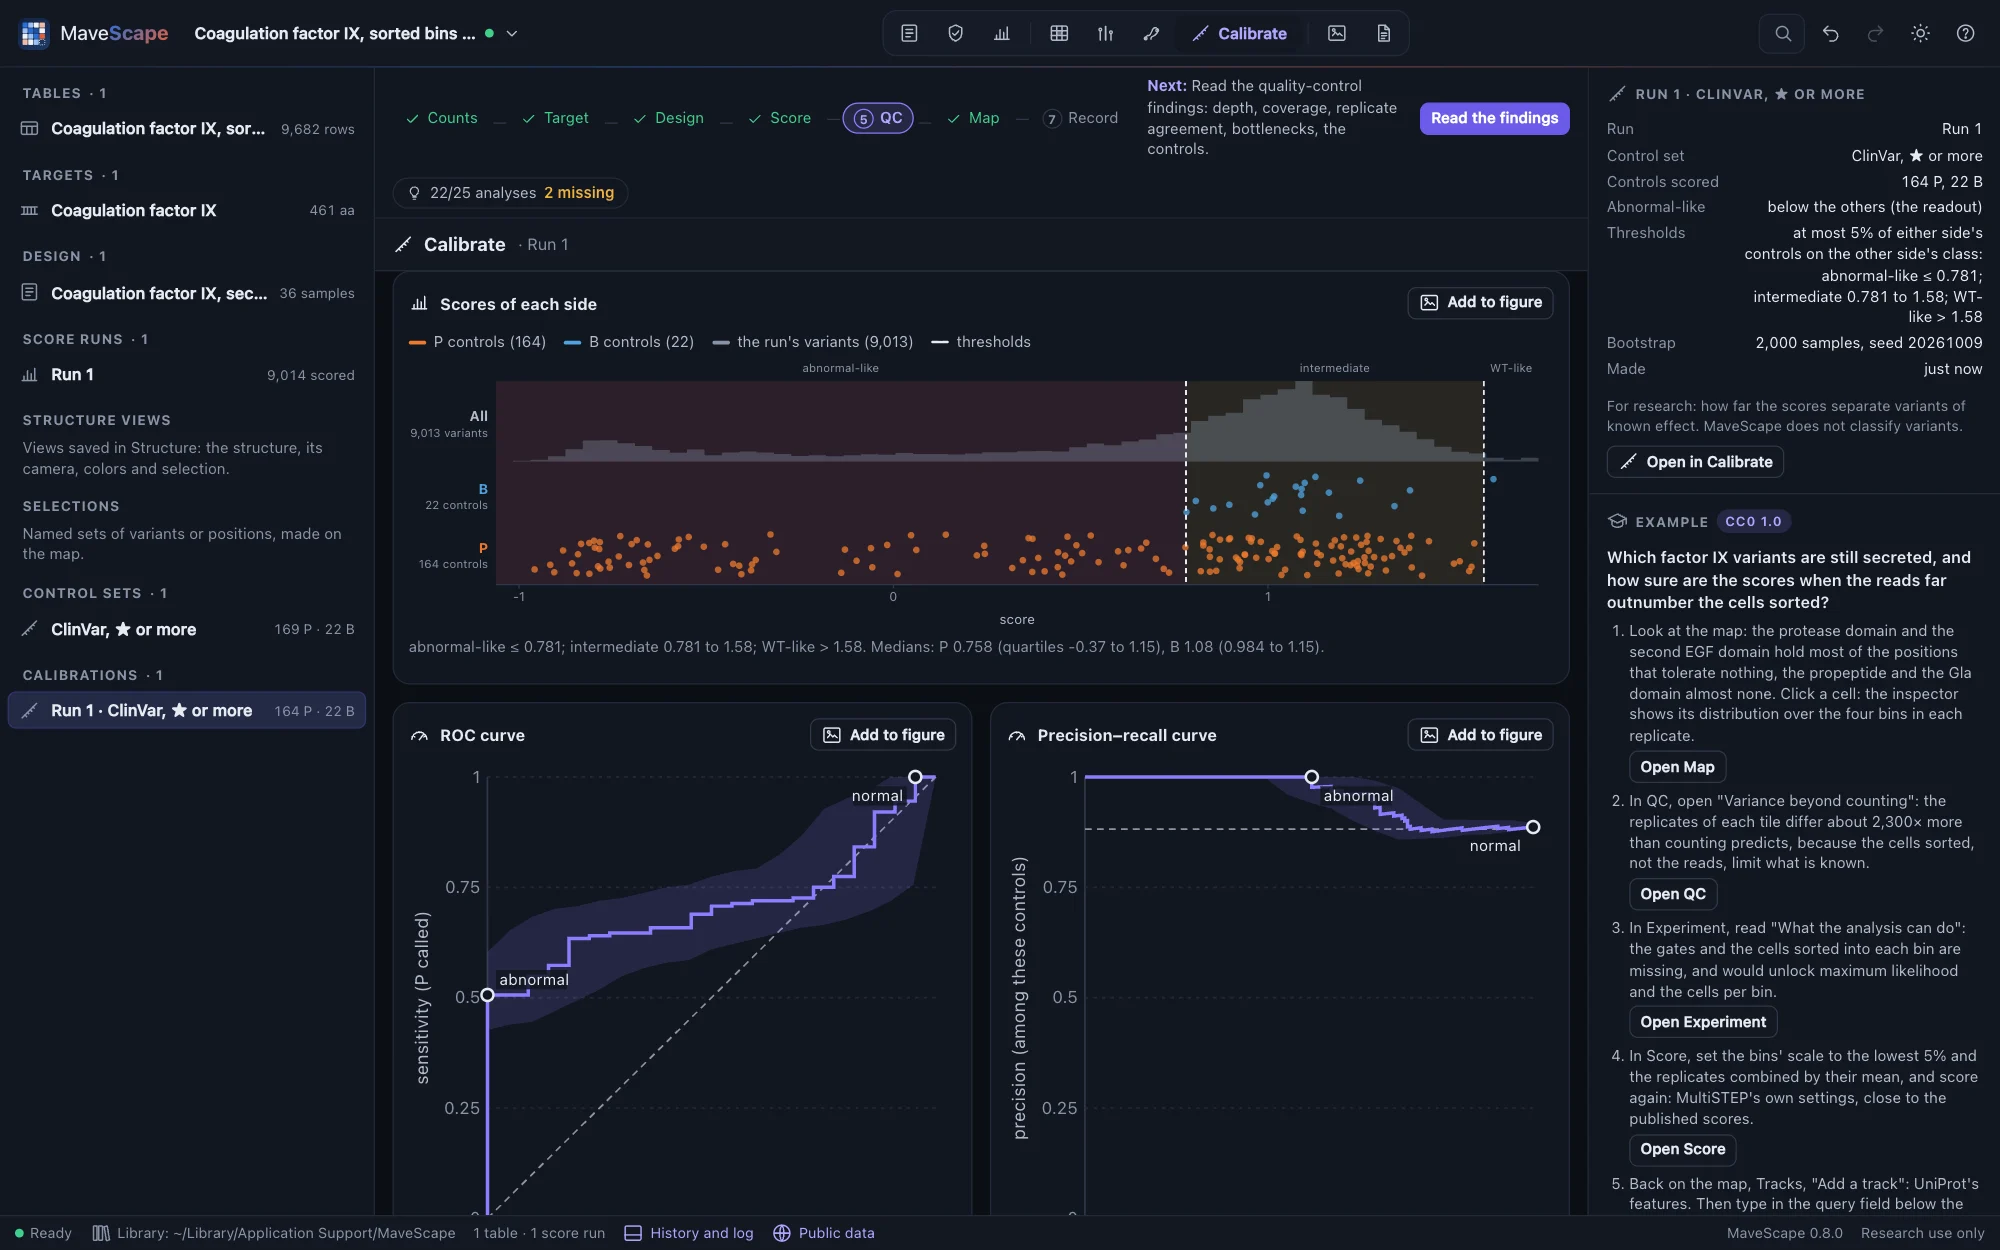
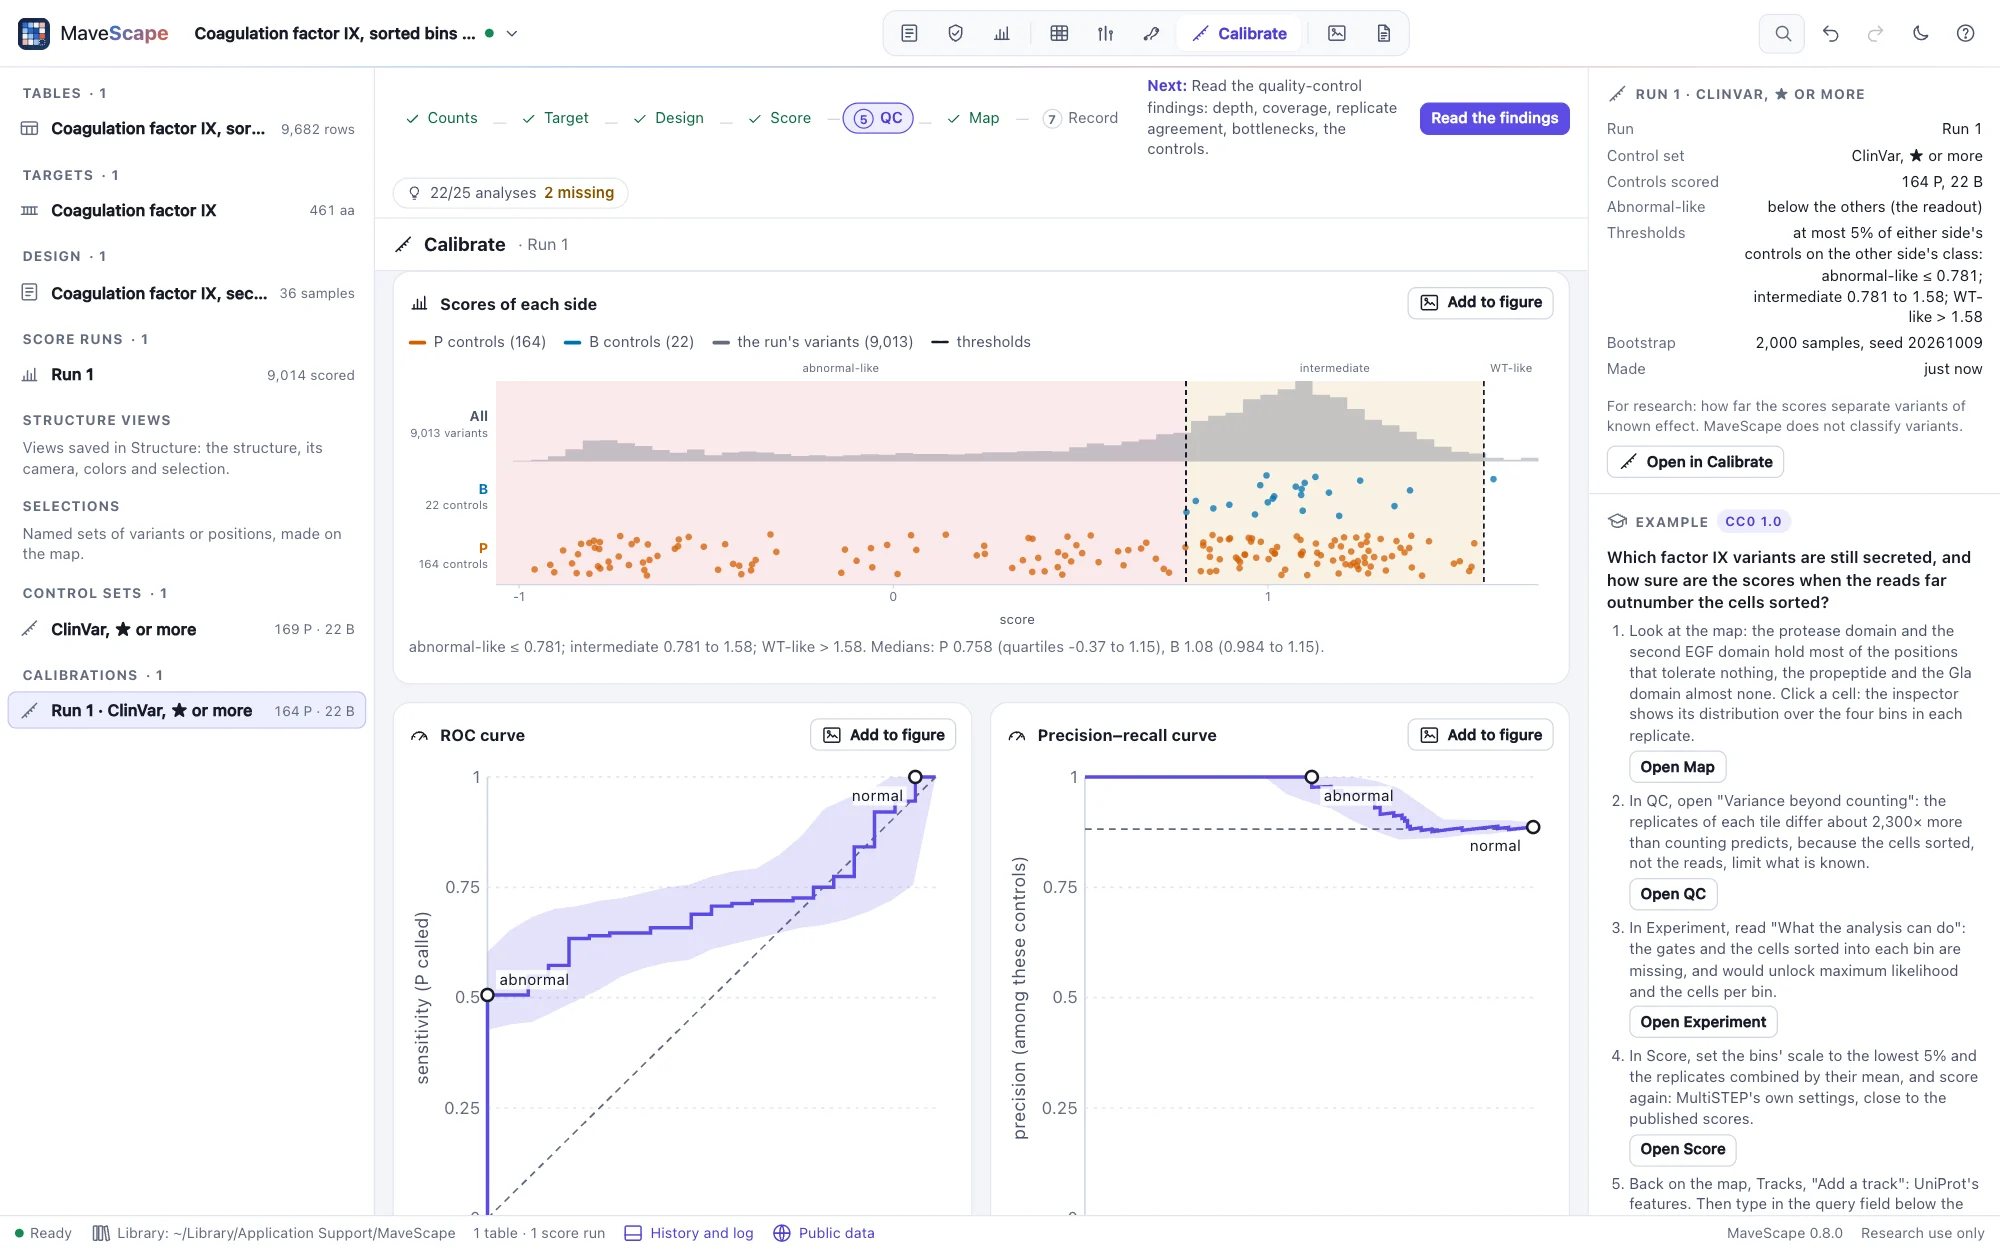
With a control set and a run shown, Calibrate measures how far the run's scores separate the set's P controls from its B controls, only the controls the run scores. It is made when asked, kept with the workspace (the dataset tree, the inspector, the archive, the history and a checkpoint's diff) and made the same way again later: the run, the set, the settings and the bootstrap's seed are all it needs. Its settings:
- Where abnormal-like scores are: below the others (lower scores, less function) or above. By default the design's readout says (Experiment, the readout's direction); where it does not, the side of the P controls' median. When the P controls' median is on the other side of the B controls', the calibration says so: the P variants may change function the other way, or the scale may run the other way.
- Thresholds, set by the controls or given: few misclassified (the default), two thresholds, the abnormal one where the most P controls are abnormal-like with at most 5% of the B controls so, the normal one where the most B controls are WT-like with at most 5% of the P controls so (the share can be changed); Youden's J, one threshold, where sensitivity + specificity is largest; or given, two numbers (a published calibration's, or chosen; the same number twice for one threshold).
- The bootstrap: 2,000 samples by default, seeded (20261009 by default), each side's controls drawn again with replacement, as many as it has.
Each side's scores
The run's scored variants as a histogram, and each side's controls as dots in a row of their own, with the classes the thresholds make: the abnormal-like zone and the intermediate one tinted. With each side's median and quartiles.
The curves
The ROC curve draws sensitivity (the P controls called abnormal-like) against 1 − specificity (the B controls called so) at every threshold between two scores. Its area, the AUC, is the chance that a P control scores more abnormal-like than a B control (half for a tie), with DeLong's 95% interval and the bootstrap's. The band is the bootstrap's 95% interval of the sensitivity at each specificity, as pROC's ci.se gives it.
The precision-recall curve draws the share of P among the controls called abnormal-like against the share of P controls called, between its points on Keilwagen, Grosse and Grau (2014)'s interpolation; its area with the bootstrap's interval, and the precision of chance, the P controls' share (the dashed line). Precision here is among these controls, in their proportion: not the share of P among variants of unknown effect, which no control set gives.
Thresholds and classes
The thresholds make three functional classes in this assay, for research: abnormal-like at or beyond the abnormal threshold, WT-like short of the normal one, and intermediate between them (the indeterminate zone; MaveDB's "not specified"). A score equal to a threshold is on its abnormal-like side. The view counts each side's controls and the run's missense variants in each class, with sensitivity (P controls abnormal-like), specificity (B controls WT-like), and the controls on the other side's class, each with Wilson's 95% interval. Where the two sides are so far apart that both thresholds hold over a range of scores, they meet in its middle and no score is intermediate. A class no threshold makes (no control far enough) is empty.
On factor IX's ClinVar controls, by the defaults, half the P controls (83 of 164) score abnormal-like and none of the B; the other half score among the B controls, so the normal threshold, which lets at most 5% of the P controls be WT-like, is above all but one B control (sensitivity 51%, 43% to 58%; specificity 5%, 1% to 22%). One threshold (Youden's J) at the same score calls every B control WT-like (specificity 100%, 85% to 100%). Secretion is what this assay measures: pathogenic variants that are secreted but do not work can score like benign ones.
How far the bootstrap moves the thresholds
Each bootstrap sample sets the thresholds again by the same rule. The view gives each threshold here, the samples' median and the interval holding 95% of them, how many samples leave a class empty, and how often the sides meet with no intermediate zone. Given thresholds are fixed: no sample moves them, and the intervals of sensitivity and specificity say how certain the classes' share of each side is.
Checked against R
The validation suite calibration computes every number on seven cases with R as well (pROC 1.19, PRROC 1.4, binom 1.1; synthetic cases of known shape, ties, sides well and fully apart, few controls, and factor IX's controls in Run 1): the ROC curve's points, the AUC and DeLong's interval, the precision-recall curve and its area, each rule's thresholds, the controls in each class and Wilson's intervals agree to 13 digits; the bootstrap's intervals agree within their Monte Carlo error (where R's quantiles fall among MaveScape's samples, 1,092 of them). Scripts and agents use calibrate, calibrations and remove_calibration; an AI agent's calibration is made at once and marked proposed.
Evidence strength, for research


Each calibration says what each of its classes would contribute as functional evidence, for research use only: the OddsPath of Brnich et al. (Genome Medicine 2020;12:3, the ClinGen SVI Working Group's recommendations for PS3 and BS3), and the evidence strength their Table 3 makes of it. The abnormal-like class is evidence toward PS3, the WT-like class toward BS3. It is not a classification of any variant: MaveScape keeps four things apart, how far the assay's scores separate the controls, a variant's functional class in this assay, the evidence strength a class would give, and a clinical classification, which MaveScape never makes.
- OddsPath = P2 (1 − P1) / ((1 − P2) P1), where P1 is the P controls' share of all the controls scored (the intermediate ones too) and P2 their share in the class with one control of the other side added, as Brnich et al. add "exactly one misclassified variant to each set": a class is never certain, and the next control may be discordant. A class with no control has none.
- Strength, each threshold strictly: beyond 2.1 PS3_supporting, 4.3 PS3_moderate, 18.7 PS3 (strong), 350 PS3_very_strong; below 0.48 BS3_supporting, 0.23 BS3_moderate, 0.053 BS3 (strong, the strongest benign code); between, indeterminate. A class whose OddsPath points the other way gives no evidence for its side.
- The bootstrap of the calibration, with its thresholds kept: each class's OddsPath interval, and the share of the samples at each strength, or with no control in the class.
Beside it, what it rests on: the controls (each side's labels as their source gives them) and what limits the evidence. Thresholds set on the same controls give an optimistic OddsPath (given thresholds, a publication's, are measured fairly); a class of few controls rests on them; a strength the bootstrap does not hold; the controls running the other way; and every circularity the control set has for the run.
On factor IX, by the defaults, the abnormal-like class (83 P controls, no B) gives OddsPath 11.1, PS3_moderate, in every sample. The WT-like class holds one B control: 0.134, BS3_moderate, but in only 58% of the samples, and in 34% no control at all. P1 is 0.88 (164 P to 22 B), so a class of one B control and the added P control is already far below the set's odds.
The validation suite calibration computes every row of Brnich et al.'s own spreadsheet (their Additional file 1: Table S1, a perfect readout, and Table S2, one control indeterminate) to 15 digits, and Table 3 at each threshold. Two things in the paper read differently: one row of Table S2 (row 63) has counts no assay can have (9 P and 1 B controls, yet 8 normal readouts), and Figure 1's example (6 B and 5 P, one B indeterminate) gives 0.24 for a normal readout, which Table 3 makes BS3_supporting where the caption says BS3_moderate. MaveScape applies Table 3 as printed.
Score-level likelihood ratios, for research
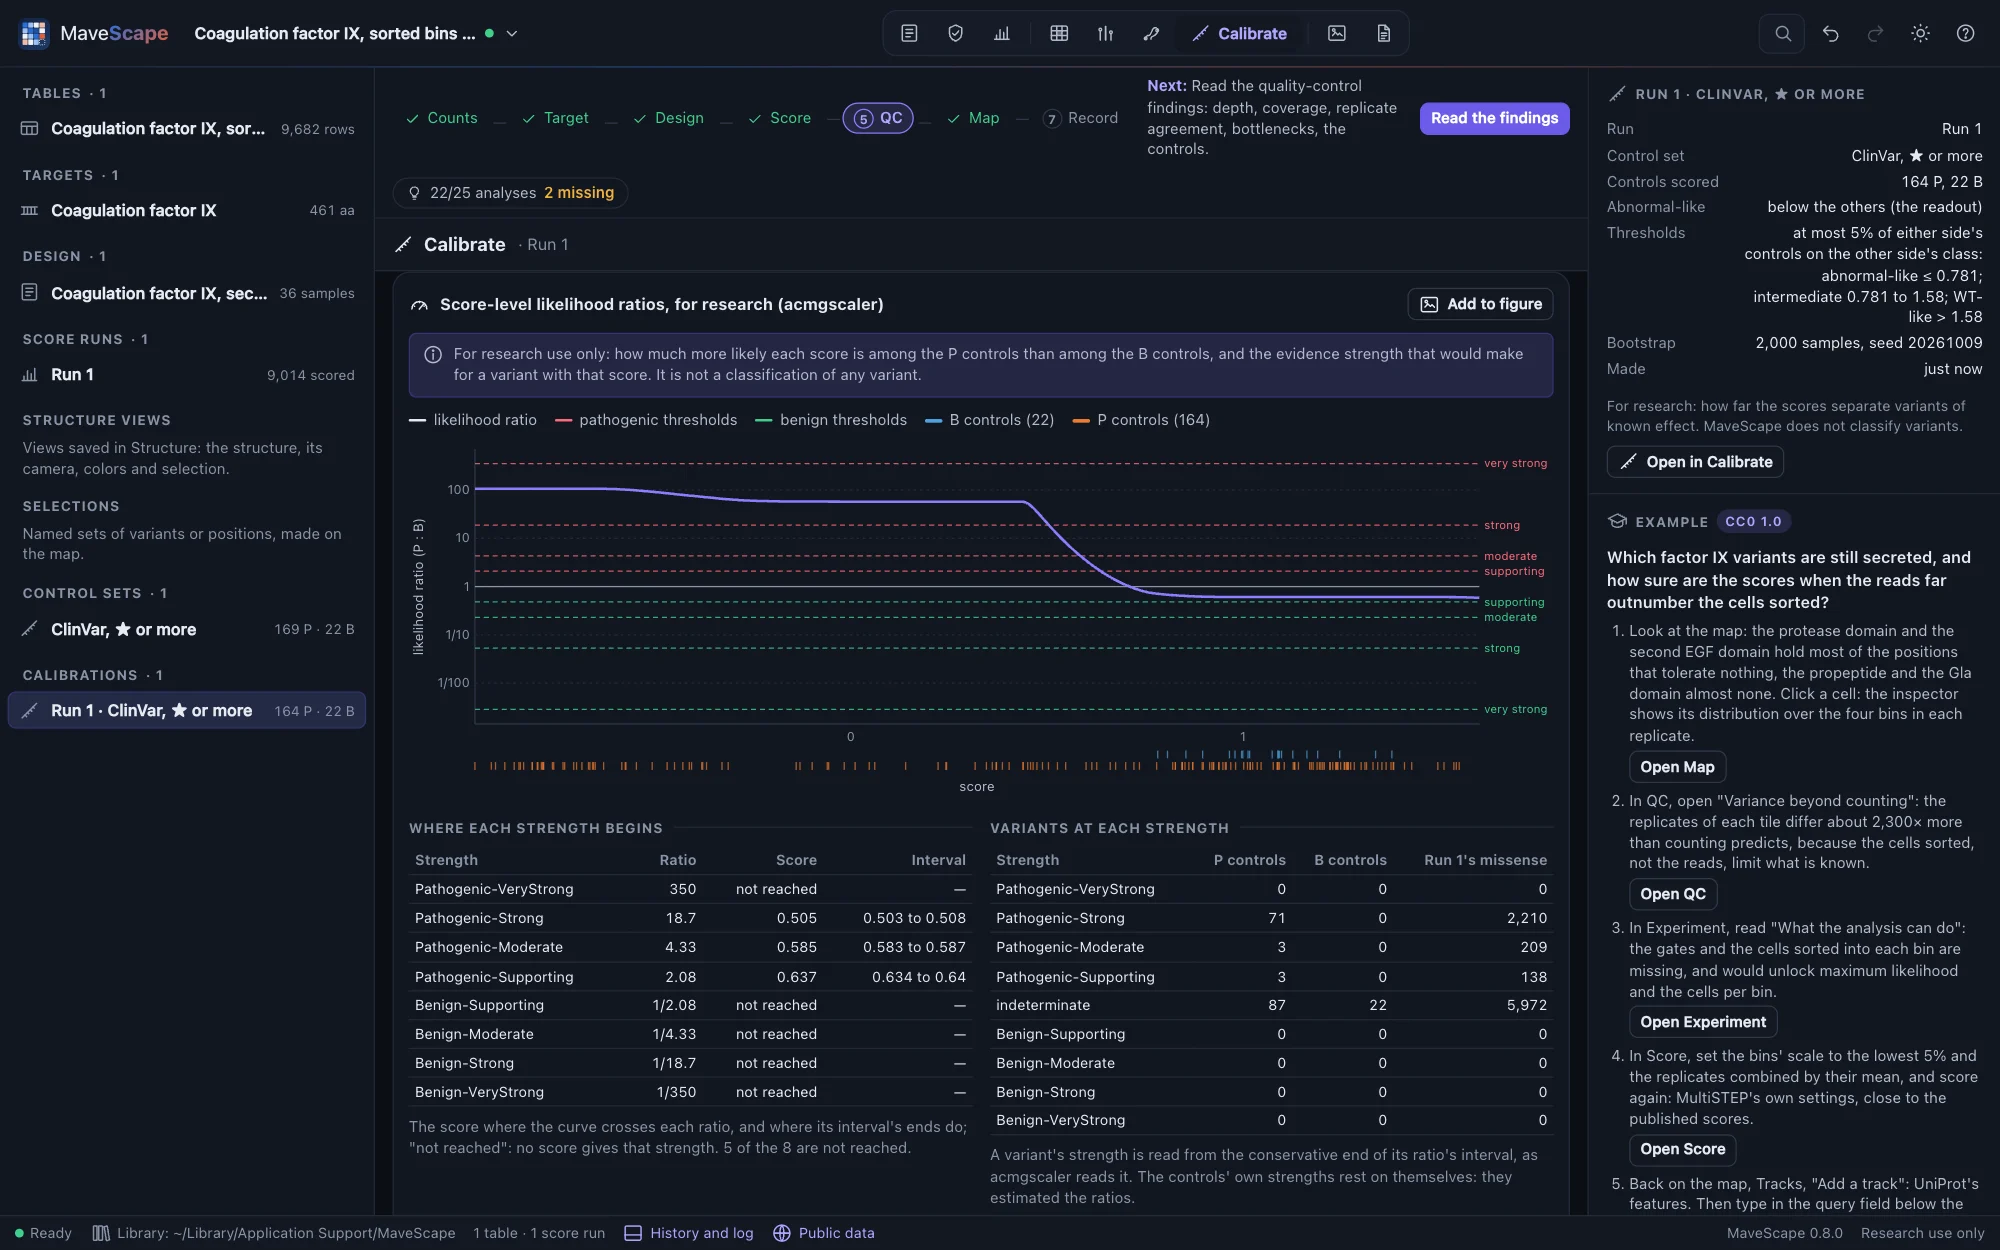
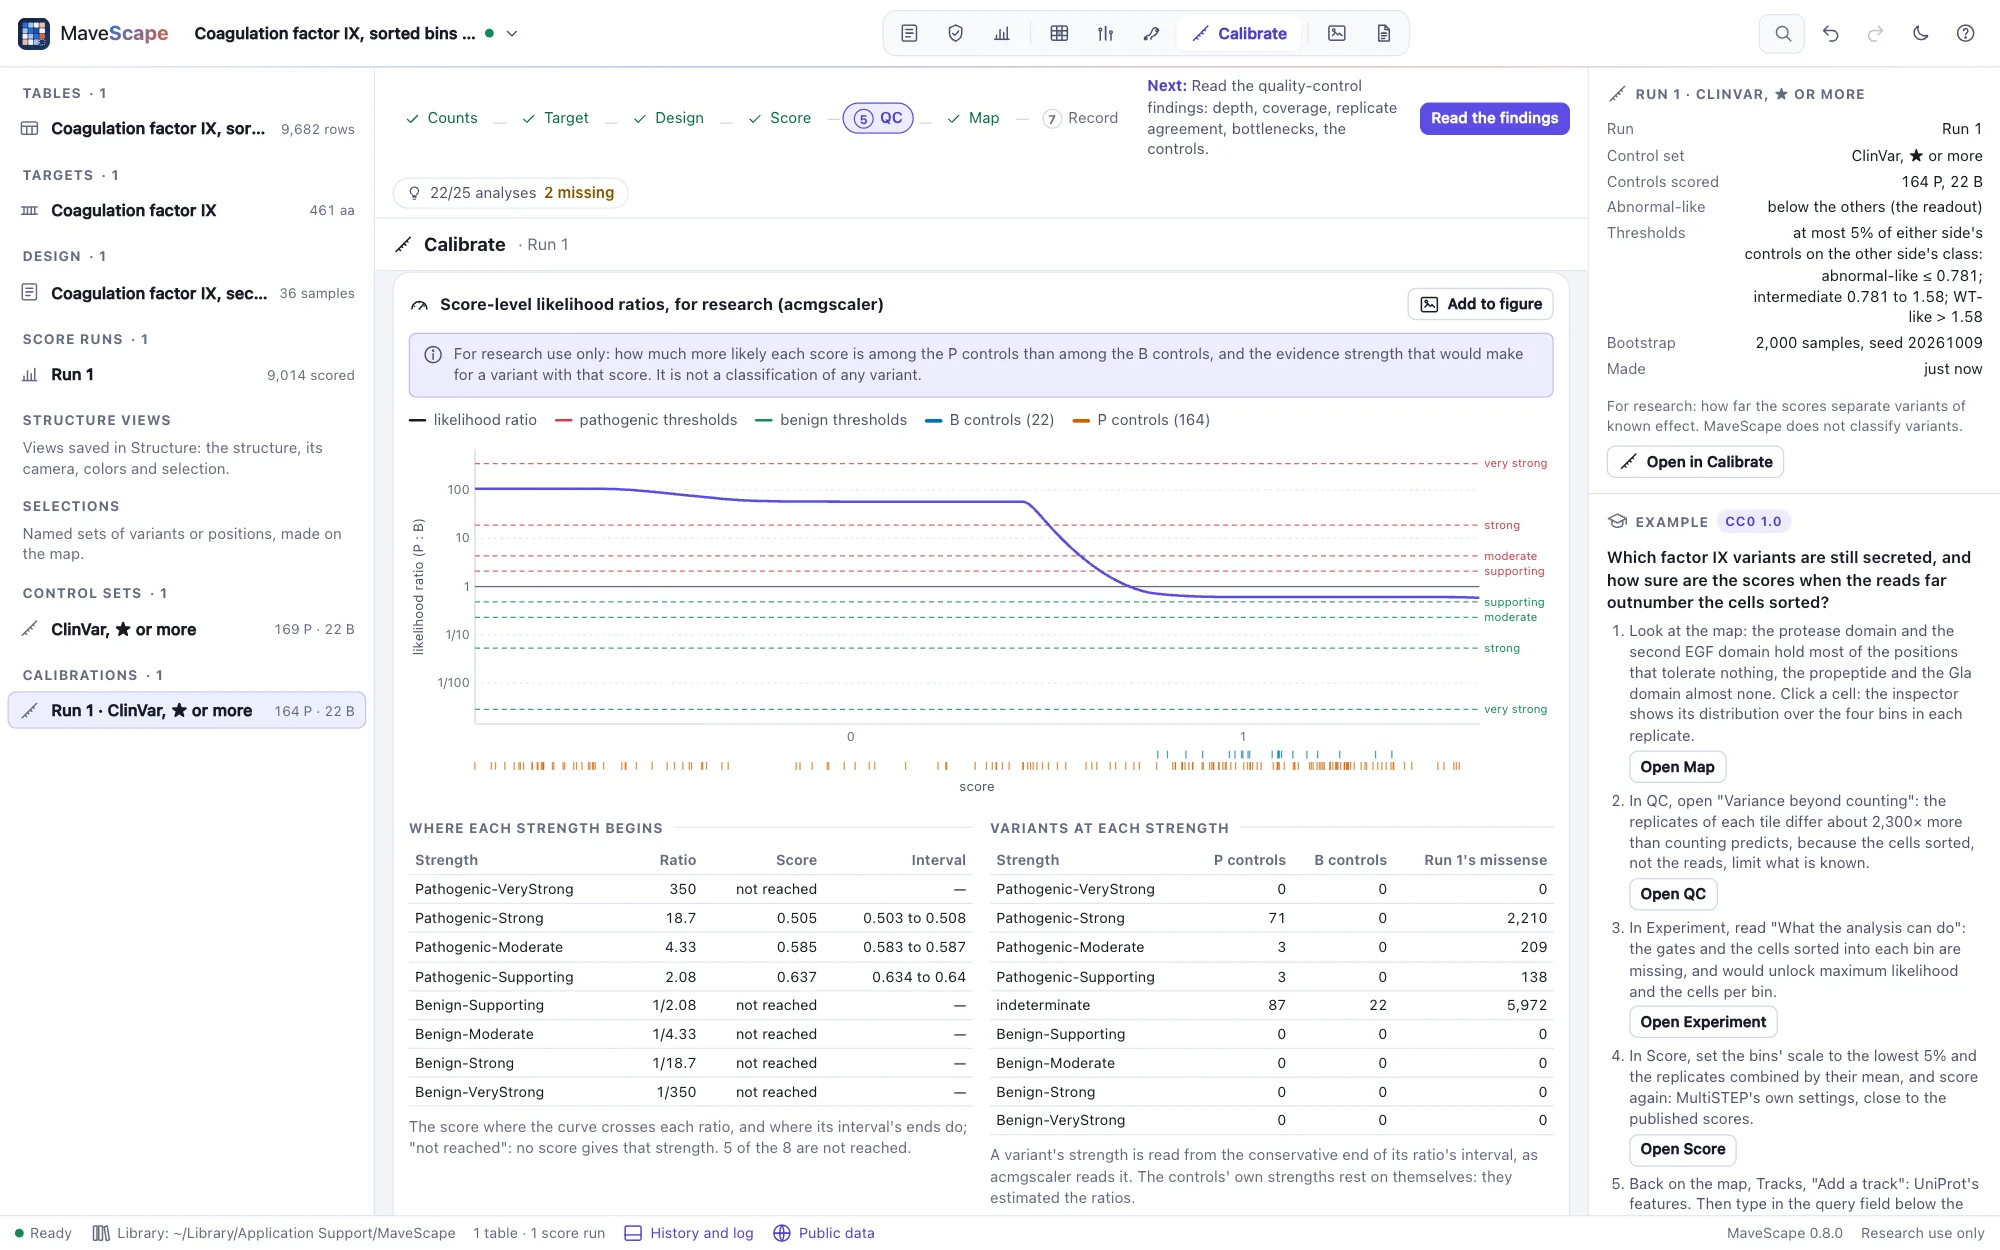
A class's OddsPath says what a whole class would give; a likelihood ratio says it for each score. Each calibration computes them as acmgscaler does (Badonyi, Bioinformatics 2025), ported from its R package 1.0.0 (MIT) and equal to it on its own examples:
- each side's density of scores (rescaled to the controls' range), a Gaussian kernel of the side's biased cross-validation bandwidth, in 1,000 bootstrap samples drawn with the calibration's seed as R's generator draws them;
- the log ratio of the two densities, regularized where they thin out, made monotone (the direction the scores' correlation with it gives), the samples' median with an interval from its order statistics, itself made monotone;
- evidence thresholds from Tavtigian et al. (2018)'s framework: a single line of very strong evidence a ratio of c, strong √c, moderate c^¼, supporting c^⅛, benign the reciprocals, with c the smallest that satisfies the ACMG/AMP combining rules at the prior: 350 at the prior 0.1, acmgscaler's default. Pejaver et al. 2022's Table 1 is the other choice: the prior 0.0441, c = 1,124 (acmgscaler's search finds 1,131 at that prior, so MaveScape gives the table's as printed);
- each variant's strength read from the conservative end of its ratio's interval, and the score where the curve, and its interval's ends, cross each threshold: where each strength begins. A strength the curve never reaches is said so.
It needs at least 10 P and 10 B controls scored, as acmgscaler does. The controls' own strengths rest on themselves (they estimated the ratios), and every limitation of the control set holds here too. MaveScape's numerics are its own, written from their publications (R is not part of MaveScape): R's generator (Matsumoto and Nishimura's Mersenne Twister, seeded and drawn as R does), the kernel density by linear binning and the FFT (Silverman 1982, R 4.4's grid), the biased cross-validation bandwidth (Scott and Terrell 1987) by Brent's minimizer, isotonic regression; each matched to R as a black box.
Published calibrations
A MaveDB record can carry calibrations of its own scores: the investigators' functional classes, and others' (Fayer et al.'s, the IGVF Coding Variant Focus Group's, ExCALIBR's), each class with its range of scores and, for some, the OddsPath and evidence strength they assign. For a run of the record's scores as published, Calibrate lists them, and Calibrate with its thresholds makes a calibration whose two thresholds are the published classes' bounds: MaveScape's OddsPath on your control set then stands beside the one the calibration states. For a run that scored the counts again, they are listed with a note: they were made on another scale.
On factor IX's published scores (urn:mavedb:00001200-a-1), the investigators' classes (non-functional below 0.691, functional above 0.910) give the abnormal class OddsPath 9.0 (PS3_moderate) against its 164 P and 22 B ClinVar controls, and the normal class 0.52 (indeterminate): 72 P controls score as functional, many pathogenic variants being secreted. The record's ExCALIBR calibration, another method on other controls, begins PS3 supporting below 0.654; acmgscaler's on these controls below 0.793.
The validation suite likelihood checks each published calibration of six records as MaveDB means it: every class with a range counts the record's scores as MaveDB counts its variants (105 classes), every OddsPath a calibration states has the strength it states by Brnich et al.'s Table 3, and each calibration's thresholds, taken as MaveScape's two, class the scores as its classes do. It also reproduces Fayer et al. 2021's BRCA1 calibration from their published data: 52.4 and 0.02, the OddsPath as observed (MaveScape gives it beside Brnich et al.'s, 39.3 and 0.025), as MaveDB's "Fayer calibration" holds them.
In the record
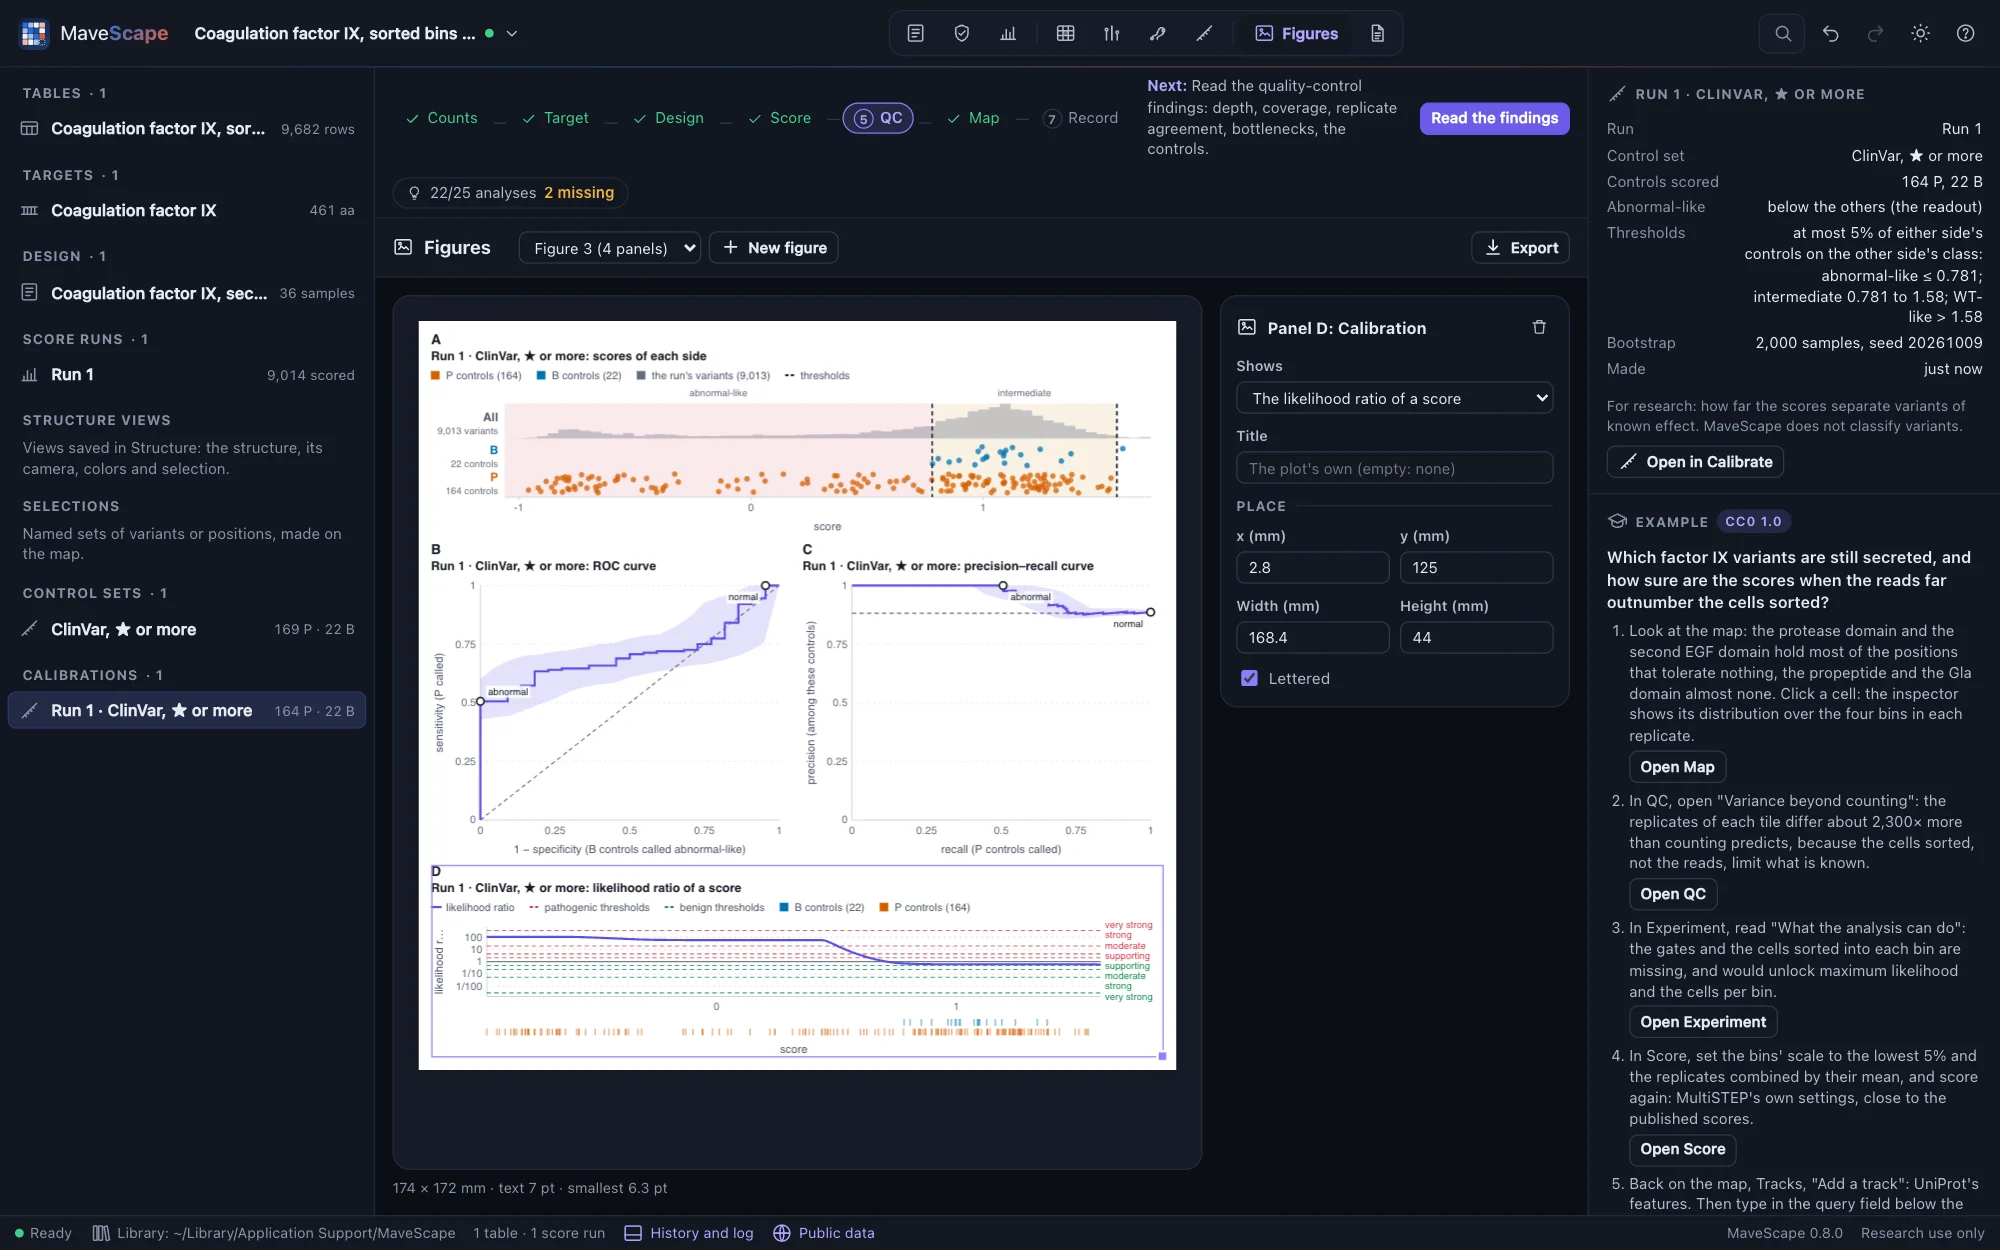
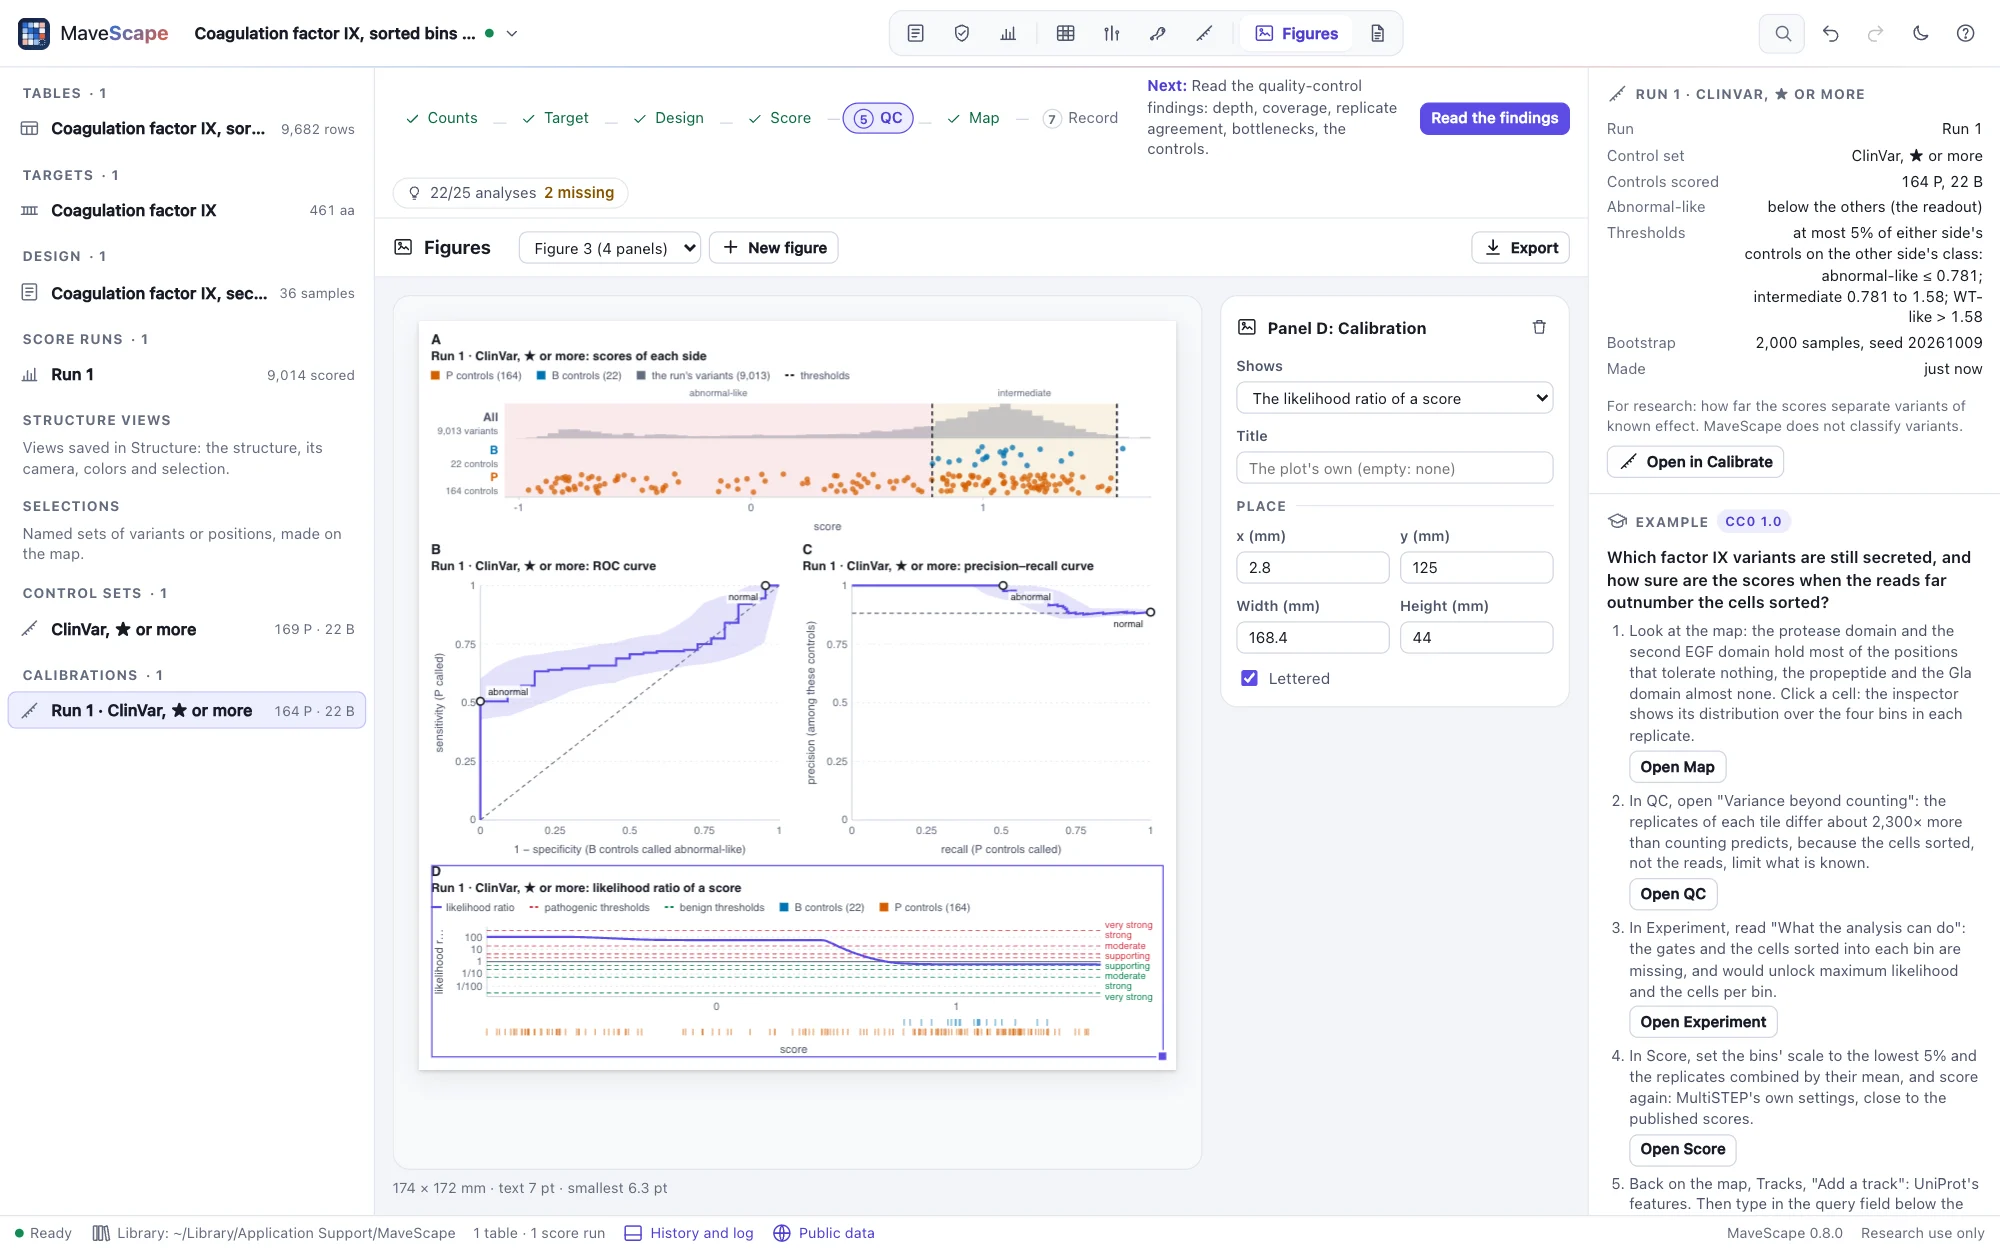
A calibration is part of the workspace's record, and of everything written from it, each time computed again from the run's scores and the control set:
- The report and a run's methods: each control set (where its labels came from, its sides in their source's words, what was left out) and each calibration as computed: the separation, the thresholds and classes, each class's OddsPath and strength, where each likelihood-ratio strength begins and the run's variants at each. Each method is cited (pROC, Keilwagen et al. and PRROC, DeLong et al., Wilson, Brnich et al., acmgscaler, Tavtigian et al., Pejaver et al. when used), and what limits a calibration is said with the limitations.
- Figures: Add to figure on each of Calibrate's plots (each side's scores, the ROC and precision–recall curves, the likelihood ratio of a score). An exported figure's manifest names the calibration as it was kept, its control set's labels and its run, so a figure checked later says when any of them changed.
- The certificate: each calibration's numbers computed again from the files and compared bit for bit: its controls scored, thresholds and their stability, the AUC and the precision–recall area with their intervals, the curves, each side's and the run's classes, each class's OddsPath with the bootstrap's, the likelihood ratios. A certificate with calibrations is format 2, so that an older MaveScape says it cannot check it rather than leaving them unchecked. The review report shows them, each number traced to the certificate.
- The checkpoint diff: a run scored again and calibrated against the same set, what that did: the thresholds, the AUC, each class's OddsPath, and the variants whose functional class changed. On factor IX, Run 1 scored again with fixed effects moves the WT-like threshold from 1.58 to 1.69 and the AUC from 0.706 to 0.715, and 343 of the 9,013 variants change class.
- A MaveDB deposit: the run's calibrations as MaveDB's score calibrations (
score_calibrations.json, each the body of MaveDB'sPOST /api/v1/score-calibrations/), in MaveDB's vocabulary: the abnormal-like class abnormal, the intermediate zone not specified, the WT-like class normal, each range bounded so that MaveDB puts a score at a threshold where MaveScape does; each class's OddsPath and the strength Table 3 makes of it; research use only; how it was made in its notes and metadata. MaveDB asks for the publication that reports the thresholds, the study's (the first of the MaveDB details' publications), and MaveScape says when there is none. A calibration made with a published calibration's thresholds is MaveDB's already and is not deposited again.
MaveDB's own validators take the deposited calibration, and its own test of a range counts every deposited score in the class MaveScape gives it (the suite mavedb-export). Read back from the package, its ranges give back the thresholds exactly, and Calibrate with its thresholds on the package's scores gives each class the same controls and the OddsPath it states. One difference is said where it matters: MaveDB reads an OddsPath as strong beyond 18.6, where Brnich et al.'s Table 3 prints 18.7. For a class between the two, MaveScape writes the ratio without its strength (MaveDB's validator refuses a strength its own reading of the ratio does not give), and the deposit's notes say why.
Four examples
Four examples teach calibration (Welcome, or open_example), each opening in Calibrate with a guide of a few steps in the inspector and every number in it checked by the validation suite examples. The three of published data bring ClinVar's records of their gene as NCBI gave them on 13 October 2026, as the ClinVar track keeps them, so that their numbers hold while ClinVar changes every week (removing the track and adding ClinVar again in Map, Tracks fetches today's).
BRCA1: strong, and resting on itself
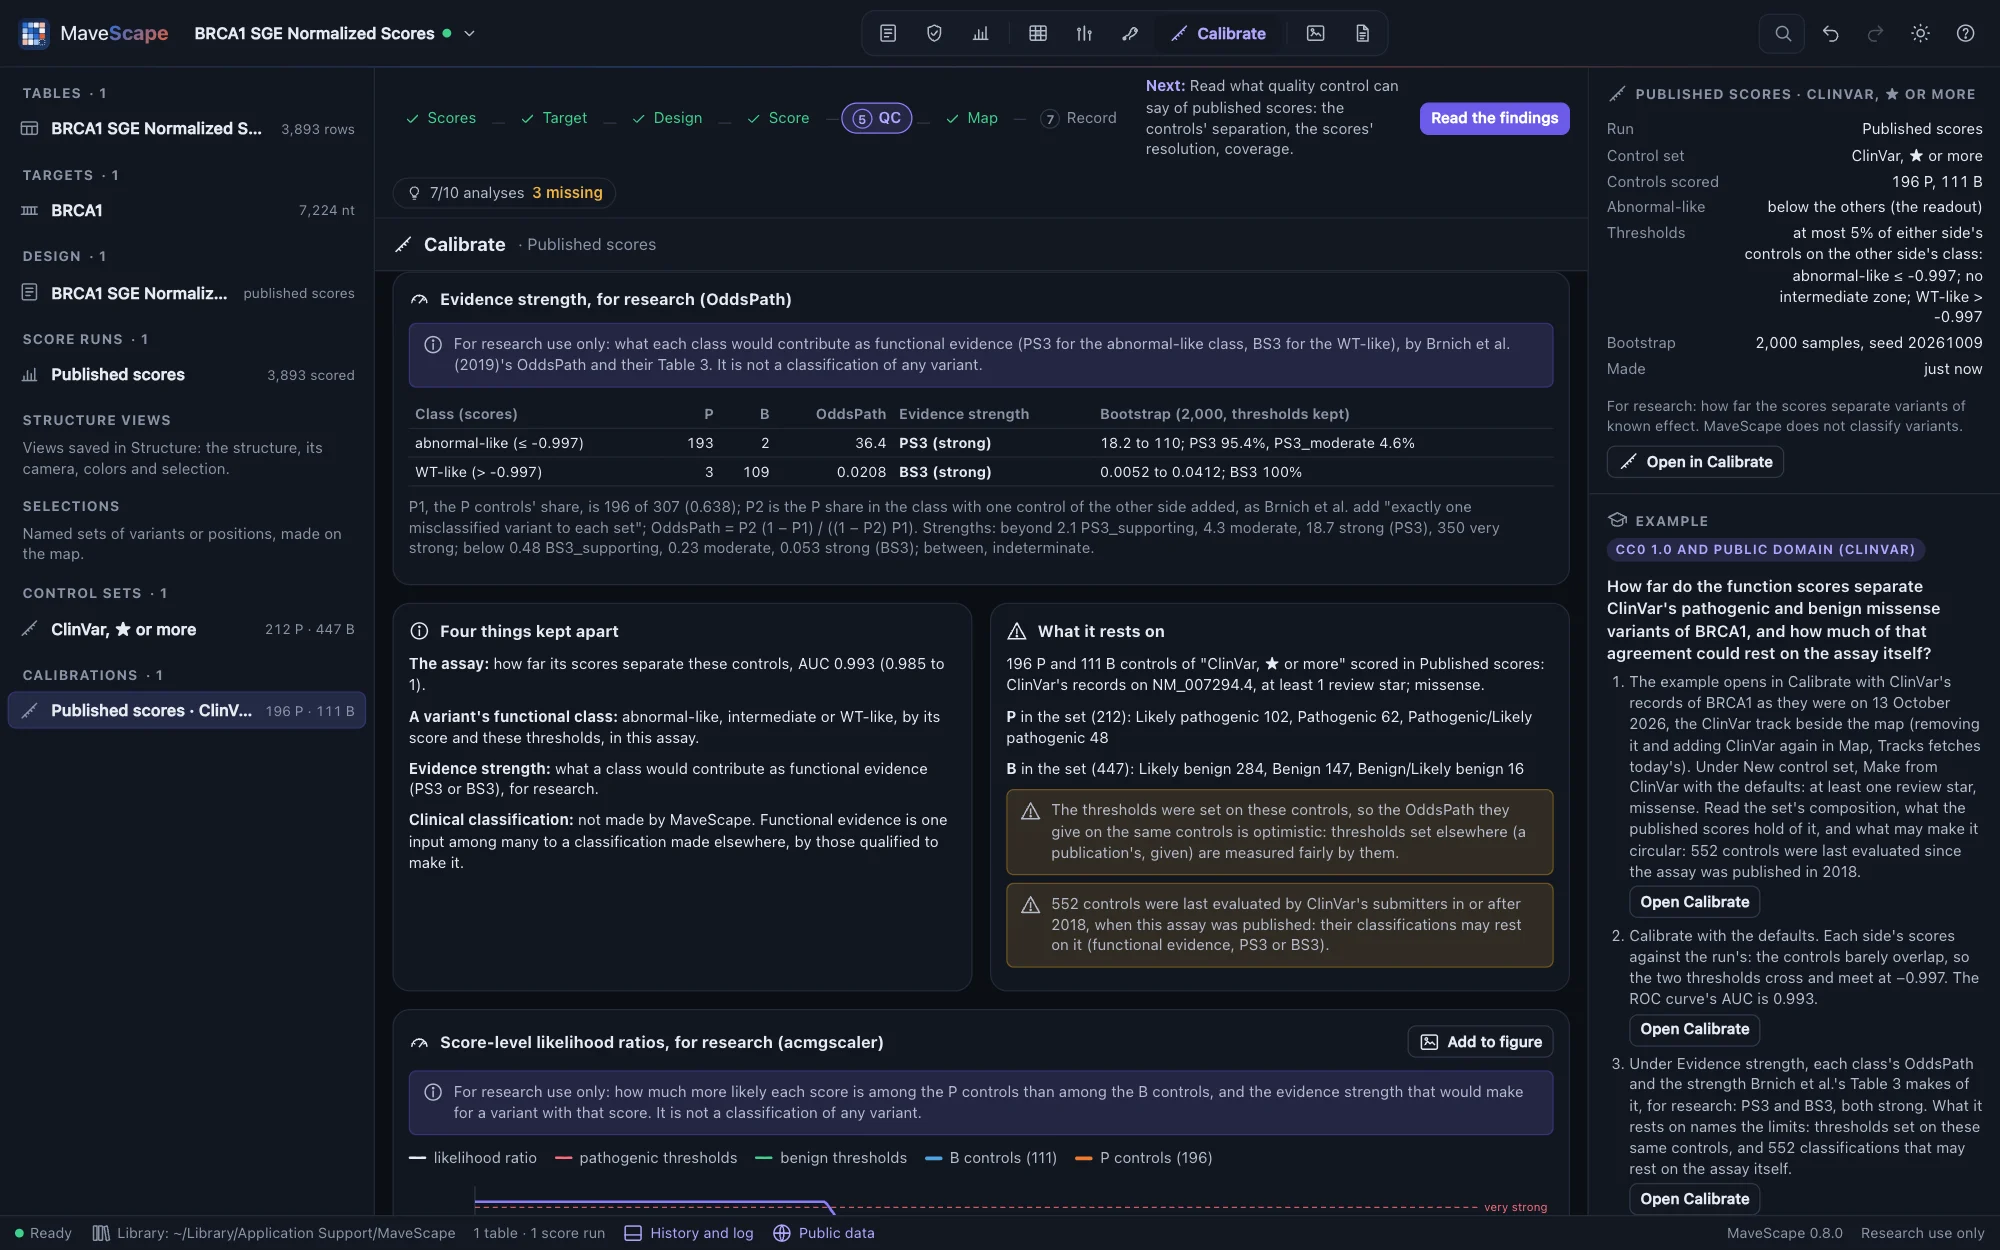

Findlay et al.'s saturation genome editing of BRCA1 (published scores, urn:mavedb:00000097-0-2) against ClinVar's missense controls with at least one star: 212 P and 447 B, of which the 13 edited exons hold 196 and 111. The scores barely overlap (AUC 0.993): the two thresholds meet at −0.997, and the abnormal-like class gives OddsPath 36.4 (PS3, strong), the WT-like 0.0208 (BS3, strong). With the record's Fayer calibration's thresholds (Findlay et al.'s classes), today's controls give 53.5 and 0.0157, beside the 52.4 and 0.02 it states from ClinVar in 2020.
But 552 of the controls were last evaluated since 2018, when the assay was published, and BRCA1's classifications may count it as functional evidence. Made again with Last evaluated before 2018, the set holds 28 P and 87 B, of which 25 and 12 are scored: they are separated as well (AUC 0.980), but the abnormal-like class's OddsPath is 9.12, moderate. Classifications made before the assay agree with it; the strength of the agreement rests on those made since.
TP53: a strength the bootstrap does not hold
Giacomelli et al.'s etoposide screen of every substitution of TP53 (urn:mavedb:00000068-c-1) against 227 P and 146 B missense controls, every one in the screen: AUC 0.984, and OddsPath 17.0 and 0.0572, moderate for both classes, but strong in about four of the bootstrap's samples in ten, so the view says the strength is not held. Only 2 P and 3 B controls were last evaluated before 2018: nearly every classification of TP53 has been evaluated again since these screens appeared. The record's ExCALIBR calibration's thresholds, set by another method, put 200 P controls and 1 B in the abnormal-like class (64.3, strong).
PTEN: abundance, and too few benign controls
Matreyek et al.'s VAMP-seq abundance of PTEN (urn:mavedb:00000013-a-1) against ClinVar: 255 P missense controls but only 9 B (8 scored), too few for any measure to rely on, as the view says. AUC 0.698; the abnormal-like class gives only supporting evidence (2.89), and with the record's ExCALIBR thresholds 44 of the 152 P controls score WT-like: a pathogenic variant can be stable and still lose its function, which an abundance assay cannot see. Made with nonsense and synonymous controls too, the AUC rises to 0.857, and MaveScape warns why that is not evidence: this record's scale sets nonsense at 0 and the wild type at 1.
A simulated calibration with circular labels
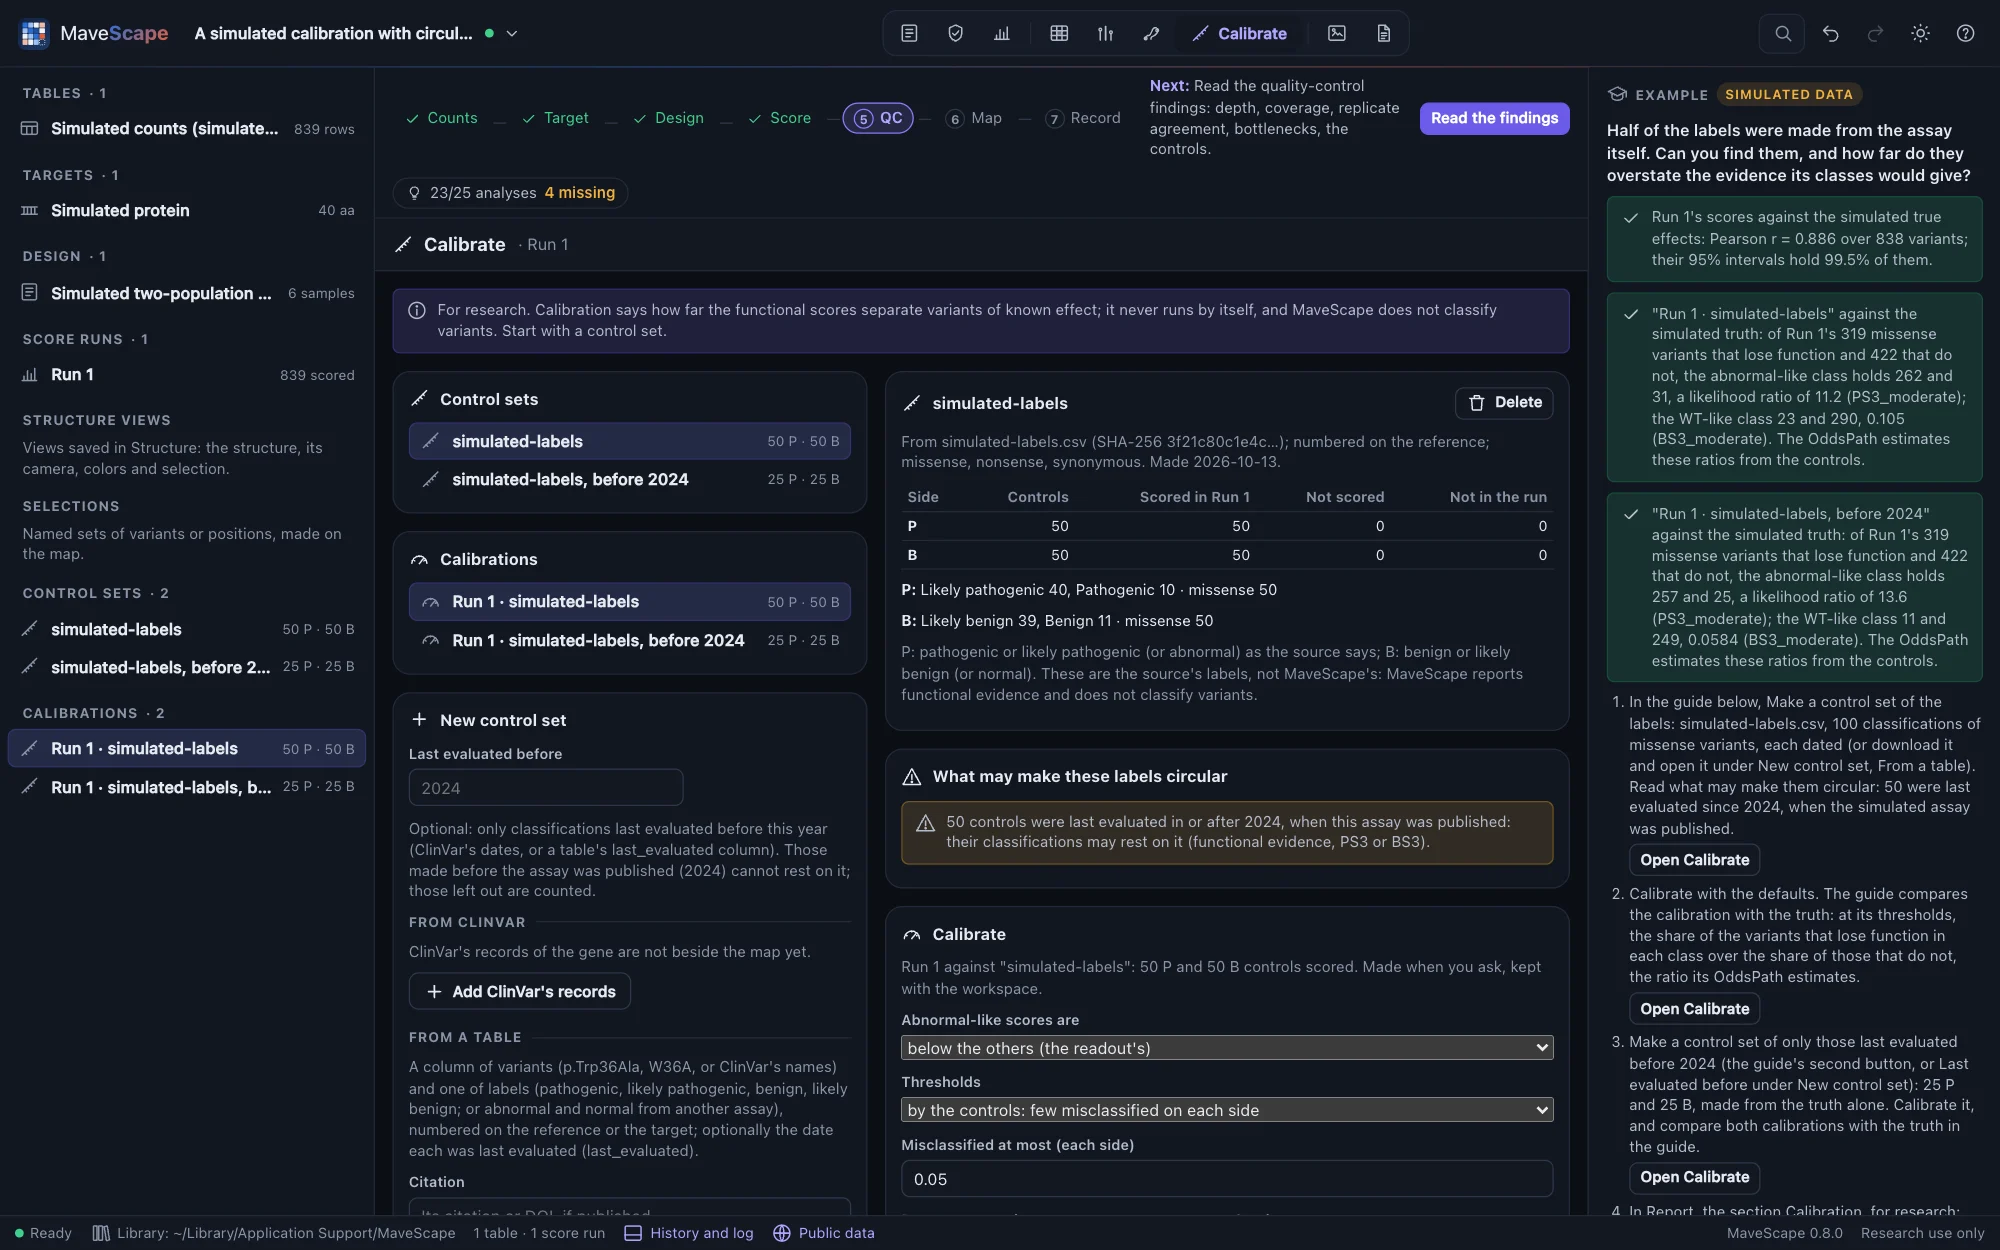

A noisy simulated selection whose every variant's effect is known, and 100 dated classifications of its missense variants: 25 a side made before the assay was "published" in 2024, from the truth alone, and 25 a side made since, from the assay's own scores (6 of them wrong by the truth). With every label, the abnormal-like class's OddsPath is 20.0, strong; at the same thresholds the truth gives a likelihood ratio of 11.2, moderate. With the labels made before 2024, 10.5 (moderate), against a truth of 13.6. MaveScape names the 50 labels that may rest on the assay; the guide shows what they do: they add confidence, not information.